How to Use DataSure
A step-by-step guide to installing DataSure, setting up your first project, importing survey data, configuring quality checks, reviewing data quality reports, correcting data, and exporting a replication package. This guide is for data managers and survey coordinators implementing DataSure for field data collection.
- DataSure follows a seven-step workflow: create a project, import data, prepare data, configure checks, review DQA reports, correct data, and export a replication package.
- First-time users should start with Demo Mode, which provides a guided walkthrough using sample household survey data.
- You can import data directly from a SurveyCTO server or upload it as a CSV, Excel, Stata, or JSON file.
- Quality check reports update automatically each time you import new data.
- The Replication Package exports auto generated Stata do-files and audit logs, allowing anyone to reproduce your corrected dataset from raw source data.
Before You Start
Before installing DataSure, confirm you have the following:
- uv, a Python package manager used to install DataSure. When you install DataSure with
uv, it automatically installs the correct version of Python and all required dependencies. The sections below cover the installation steps. - At least 4 GB of RAM and 1 GB of free storage.
If you are not comfortable working in a terminal, ask your IT support team or a technically experienced colleague to help with the installation steps.
Installing DataSure
Install DataSure as a command-line tool using uv.
Step 1: Install uv
Windows:
winget install astral-sh.uvAfter installing on Windows, run the following command to update your system path so that tools installed by uv are accessible from the terminal:
uv tool update-shellmacOS or Linux:
brew install uvIf you run into any issues installing uv, see the uv installation documentation for additional installation methods and troubleshooting guidance. For more on using uv with Python projects, see Python with uv.
Step 2: Install DataSure
uv tool install datasureStep 3: Verify the installation
datasure --versionYou should see a version number, for example datasure 1.0.0. If you see an error, confirm that you installed uv correctly and that your system path updated after installation.
Launching DataSure
To start DataSure, open a terminal and run:
datasureDataSure opens in your default web browser, typically at http://localhost:8501. Keep the terminal window open while you work; closing it will stop the application.
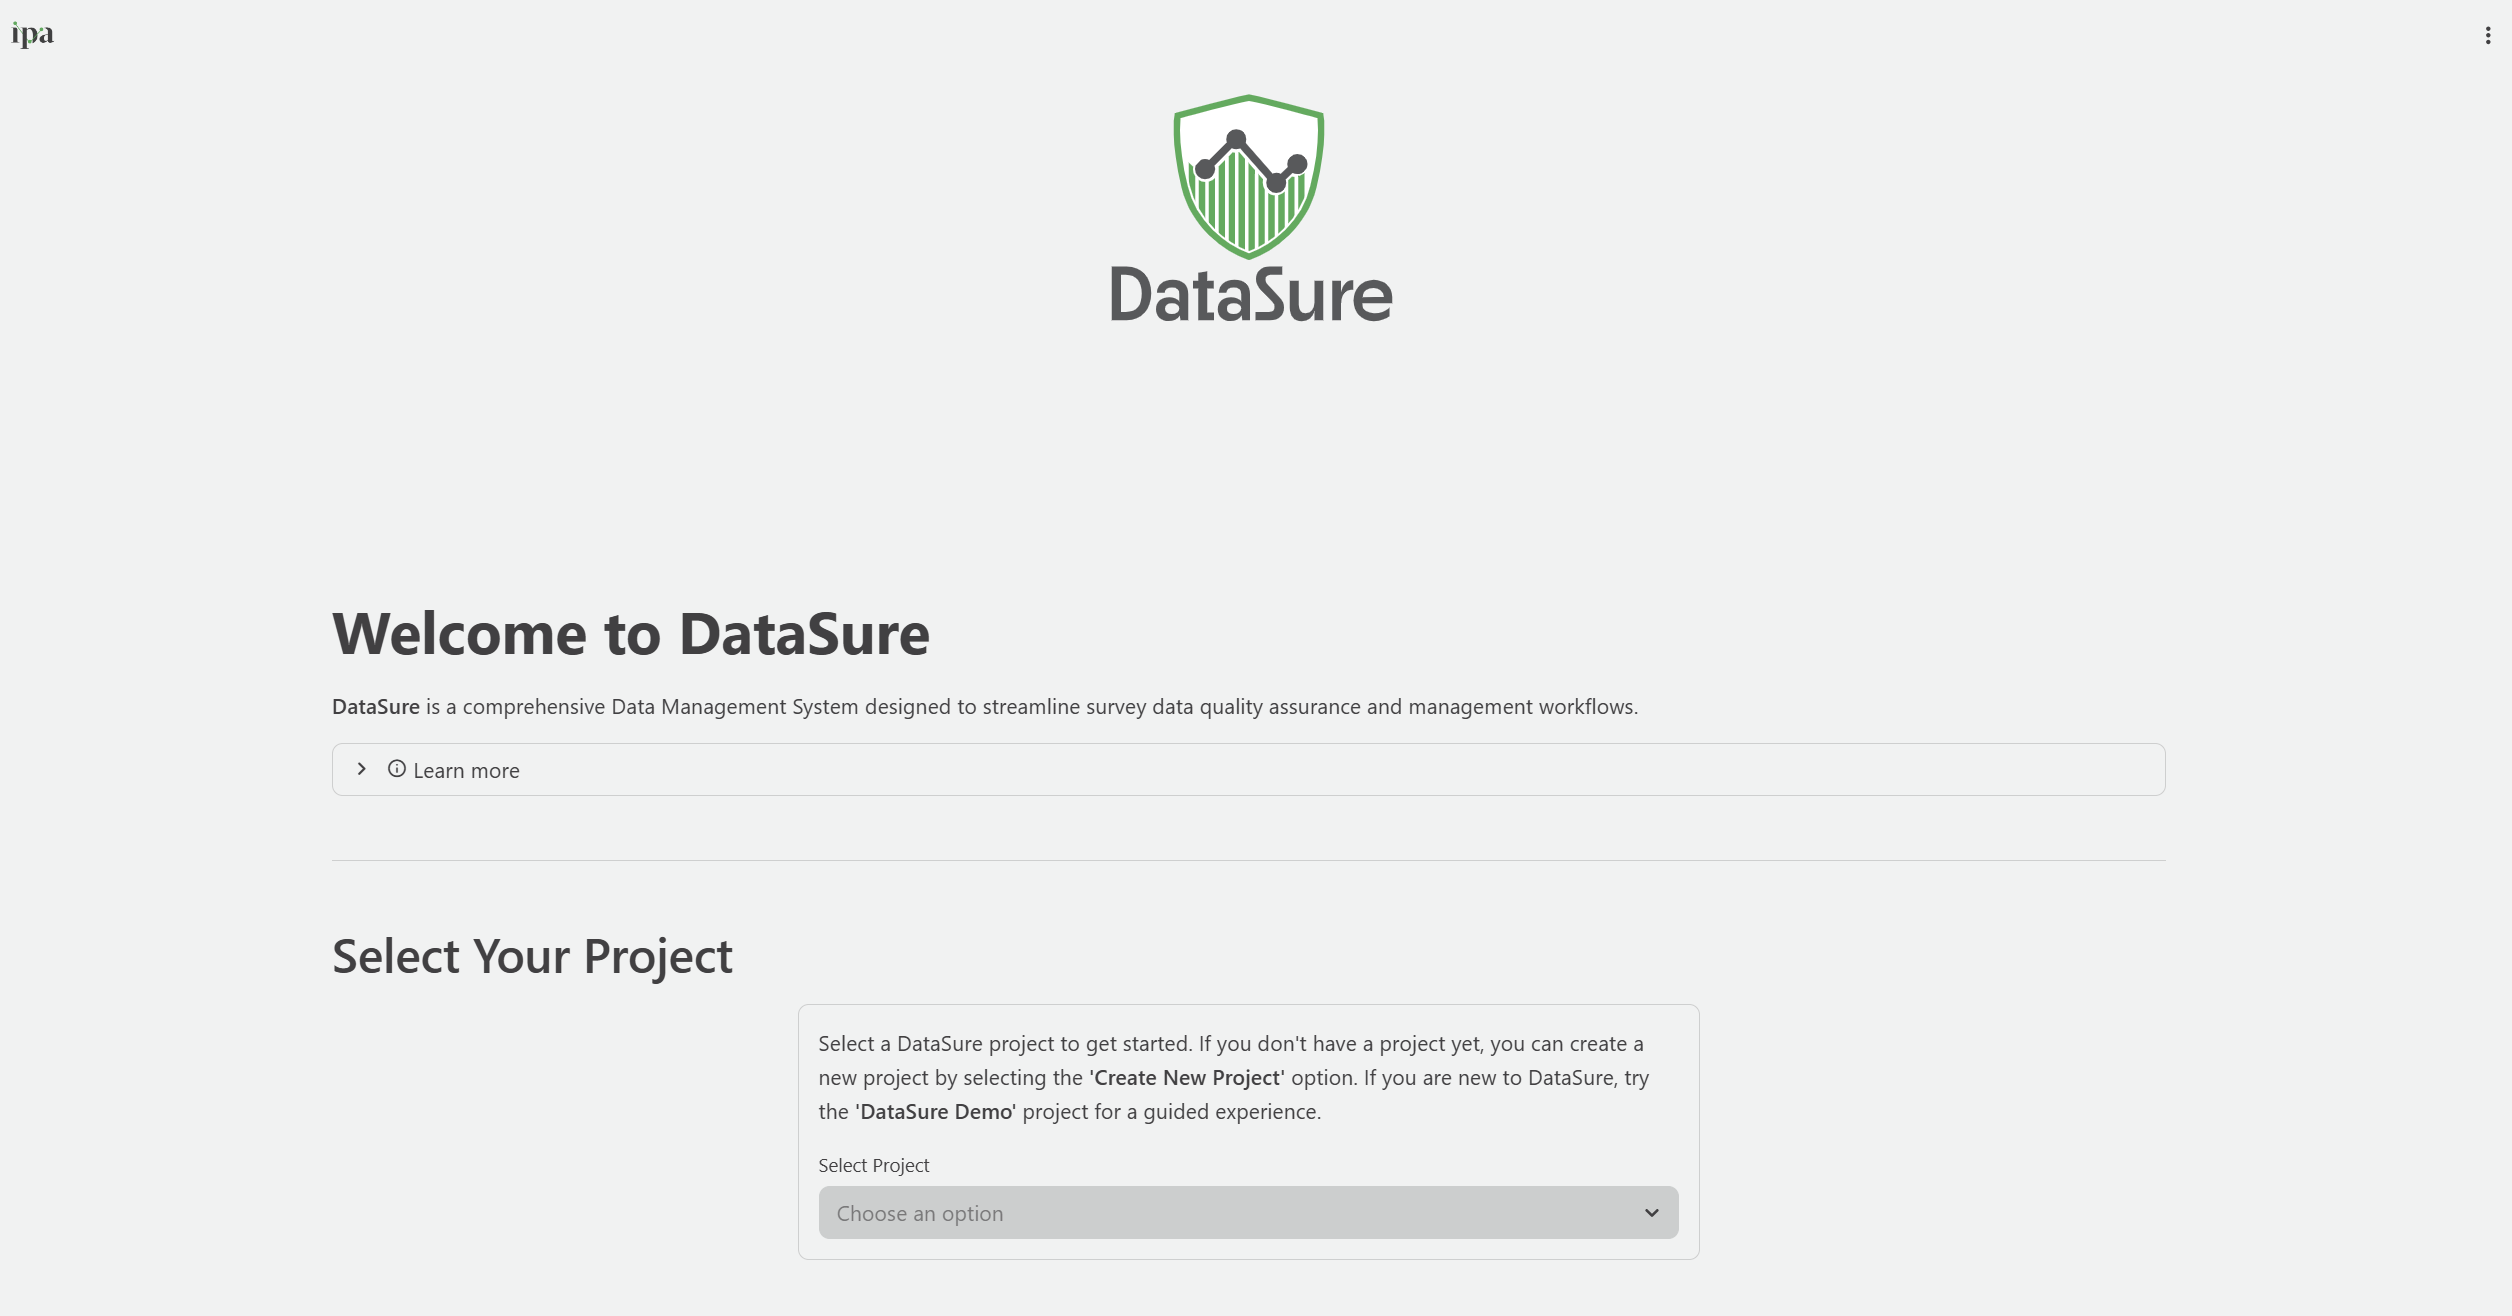
You will land on the Start Here page, which is your home base for creating, selecting, and managing projects.
Command-line options
# Launch on a custom host and port
datasure --host 0.0.0.0 --port 8080

# View all available options
datasure --help
Getting Familiar: Try Demo Mode First
If this is your first time using DataSure, start with Demo Mode before working with your own data. Demo Mode loads a pre-built sample project and guides you through all seven steps of the DataSure workflow with realistic household survey data. It is the fastest way to understand how each part of the tool works without any risk to real project data.
Starting Demo Mode
- On the Start Here page, select DataSure Demo from the project dropdown.
- If you have not run the demo before, click Start Demo. DataSure will automatically load the sample datasets.
- If you have run the demo previously, you will see two options:
- Resume Demo: Continue from where you left off, including any prep steps, configurations, and corrections you made.
- Restart Demo: Delete all demo progress and start fresh. DataSure will ask you to confirm before proceeding, since this cannot be undone.
What the demo includes
Demo Mode uses two sample datasets based on a fictional household survey in rural India:
- demo_survey: 132 household survey responses covering demographics, income, land ownership, education access, and living conditions
- demo_backcheck: 30 re-interview validation records matched to the survey data by household ID eg.
hhid.
Both datasets contain intentional data quality issues, including missing values, duplicate household IDs, and numeric outliers, so you can practice identifying and correcting real problems.
Following demo guidance
Throughout Demo Mode, look for the light blue Learn More boxes that appear on each page. These boxes explain what to do at each step and why, and they include specific instructions tailored to the demo data. DataSure expands them by default; click to collapse them once you have read them.
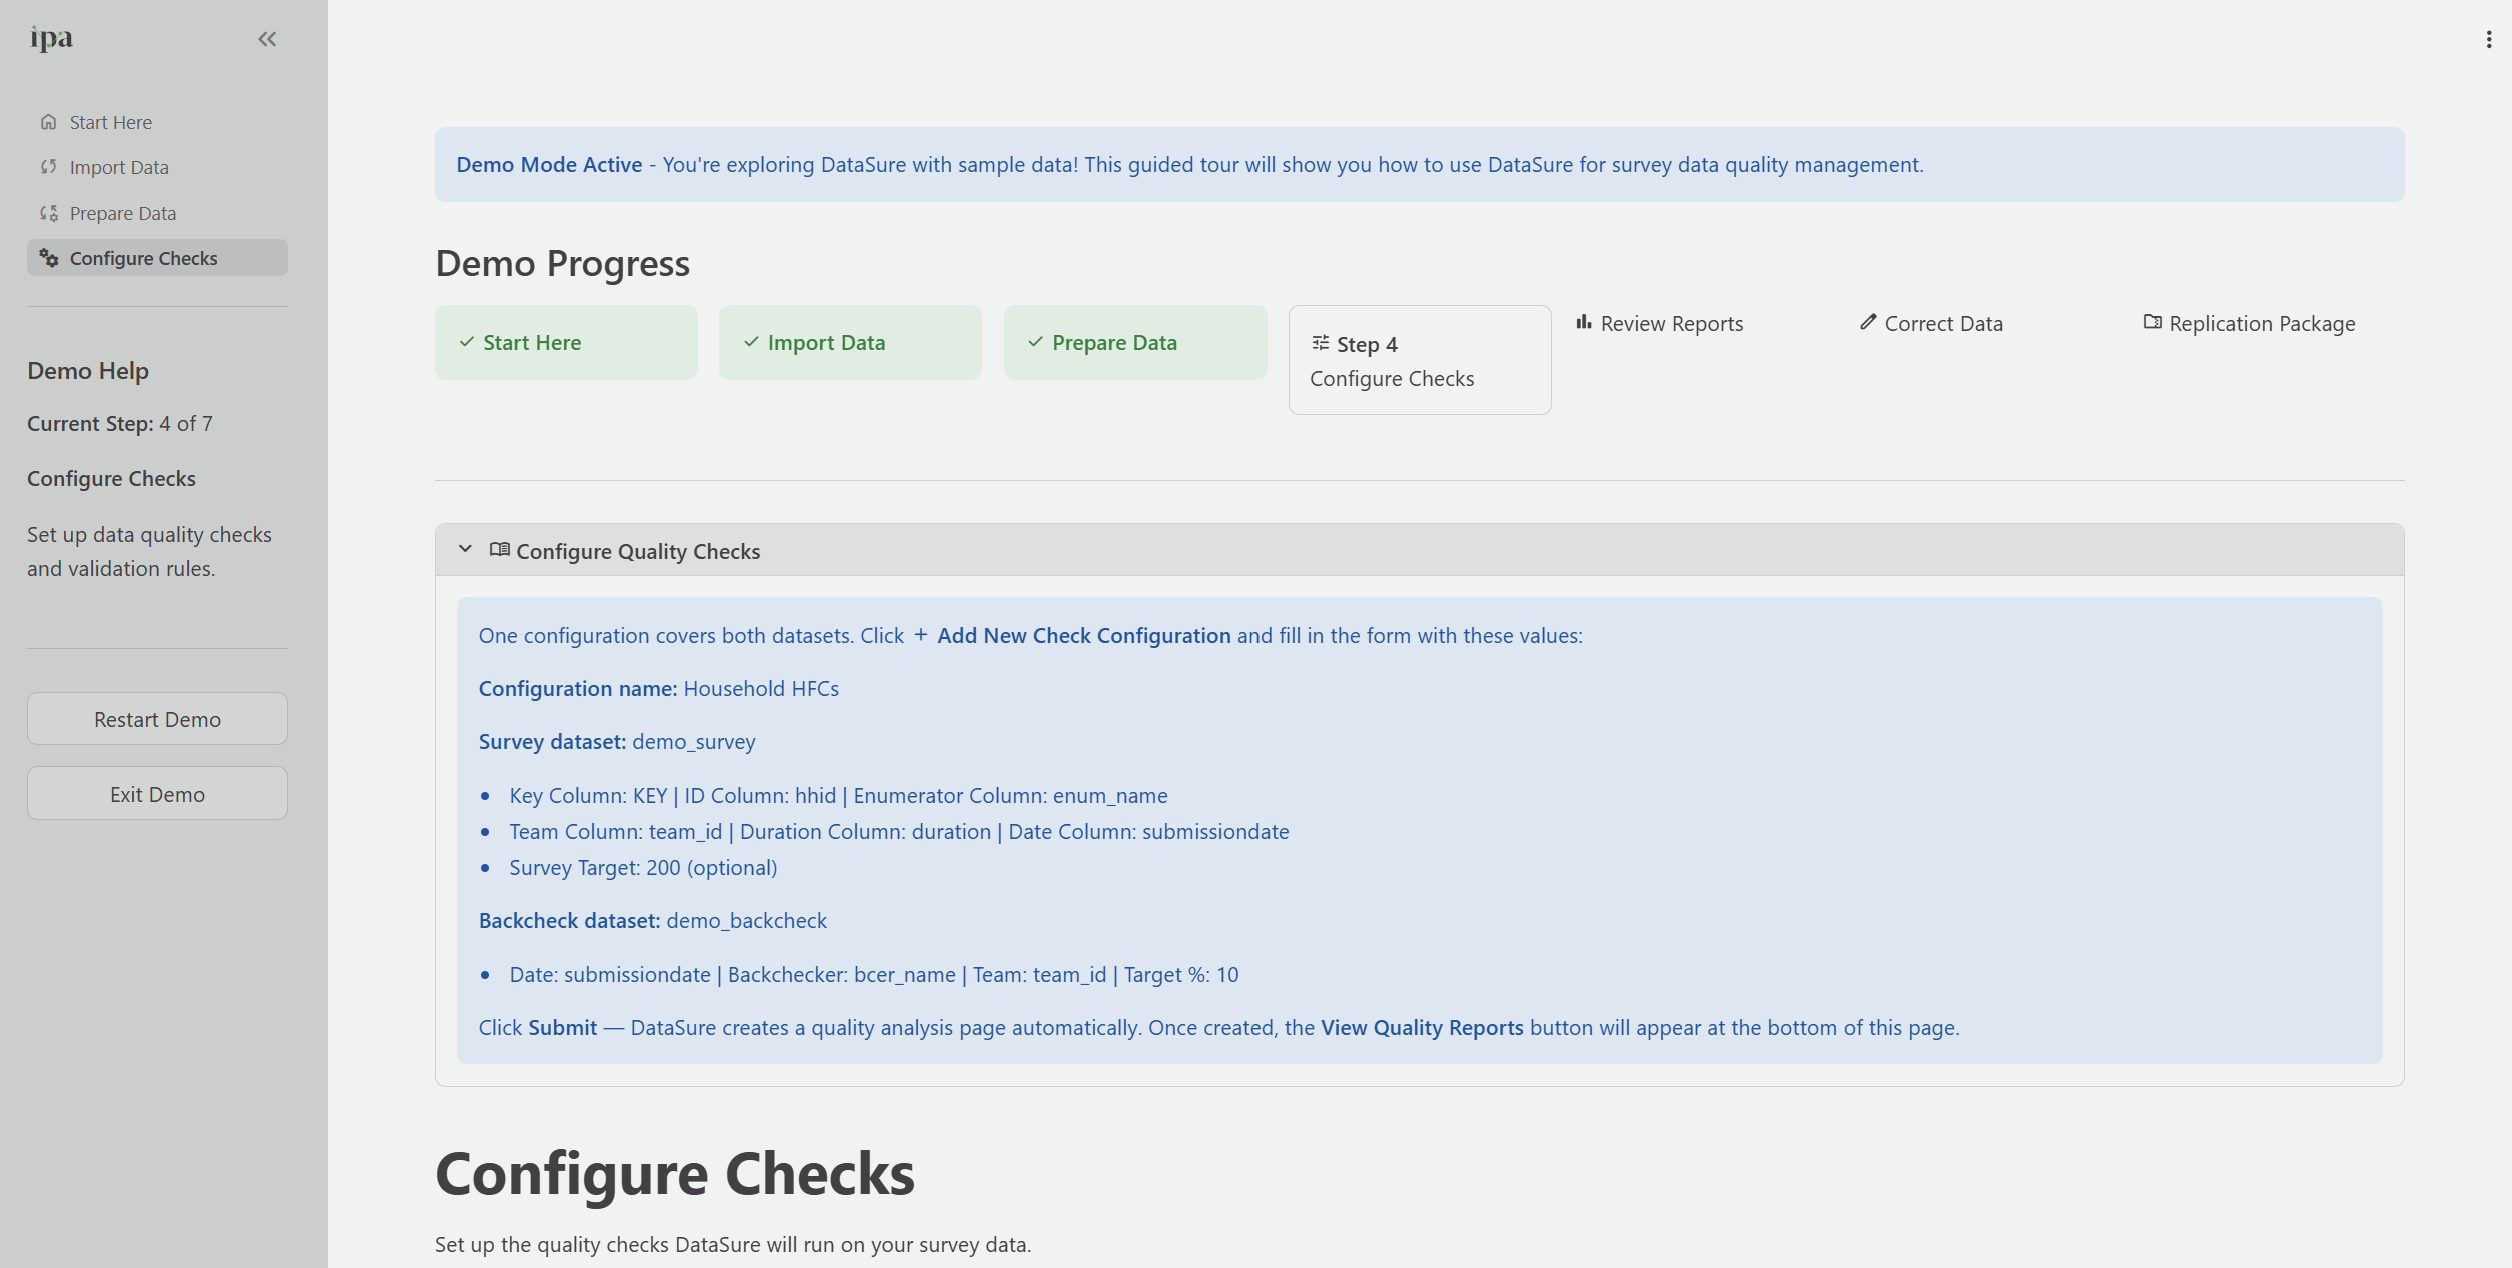
The demo tracks your progress through a seven-step indicator at the top of each page. The indicator marks completed steps, and DataSure highlights your current step.
After completing all seven steps, DataSure will confirm that the demo is complete and give you the option to restart the demo or end it. You can then create your own project from the Start Here page.
Step 1: Create or Open a Project
DataSure organizes each survey or data collection exercise as a project. A project stores your imported datasets, configuration settings, quality check outputs, correction history, and prep logs, all in a local cache on your computer.
Creating a new project
On the Start Here page, select Create New Project from the project dropdown.
Enter a descriptive project name. Project names can contain letters, numbers, spaces, dashes, and underscores, and must be at least three characters long.
Good examples:
TCAI Baseline 2026,Kidigo DDEP Endline 2024,ORS-Zinc Midline 2020Click Create Project. DataSure generates a unique project ID from the name and sets up the local cache folder structure automatically.
Use one project per survey wave or data collection phase. A consistent naming convention such as [survey] [wave] [year] makes it easy to manage multiple projects over time and to hand off projects to colleagues.
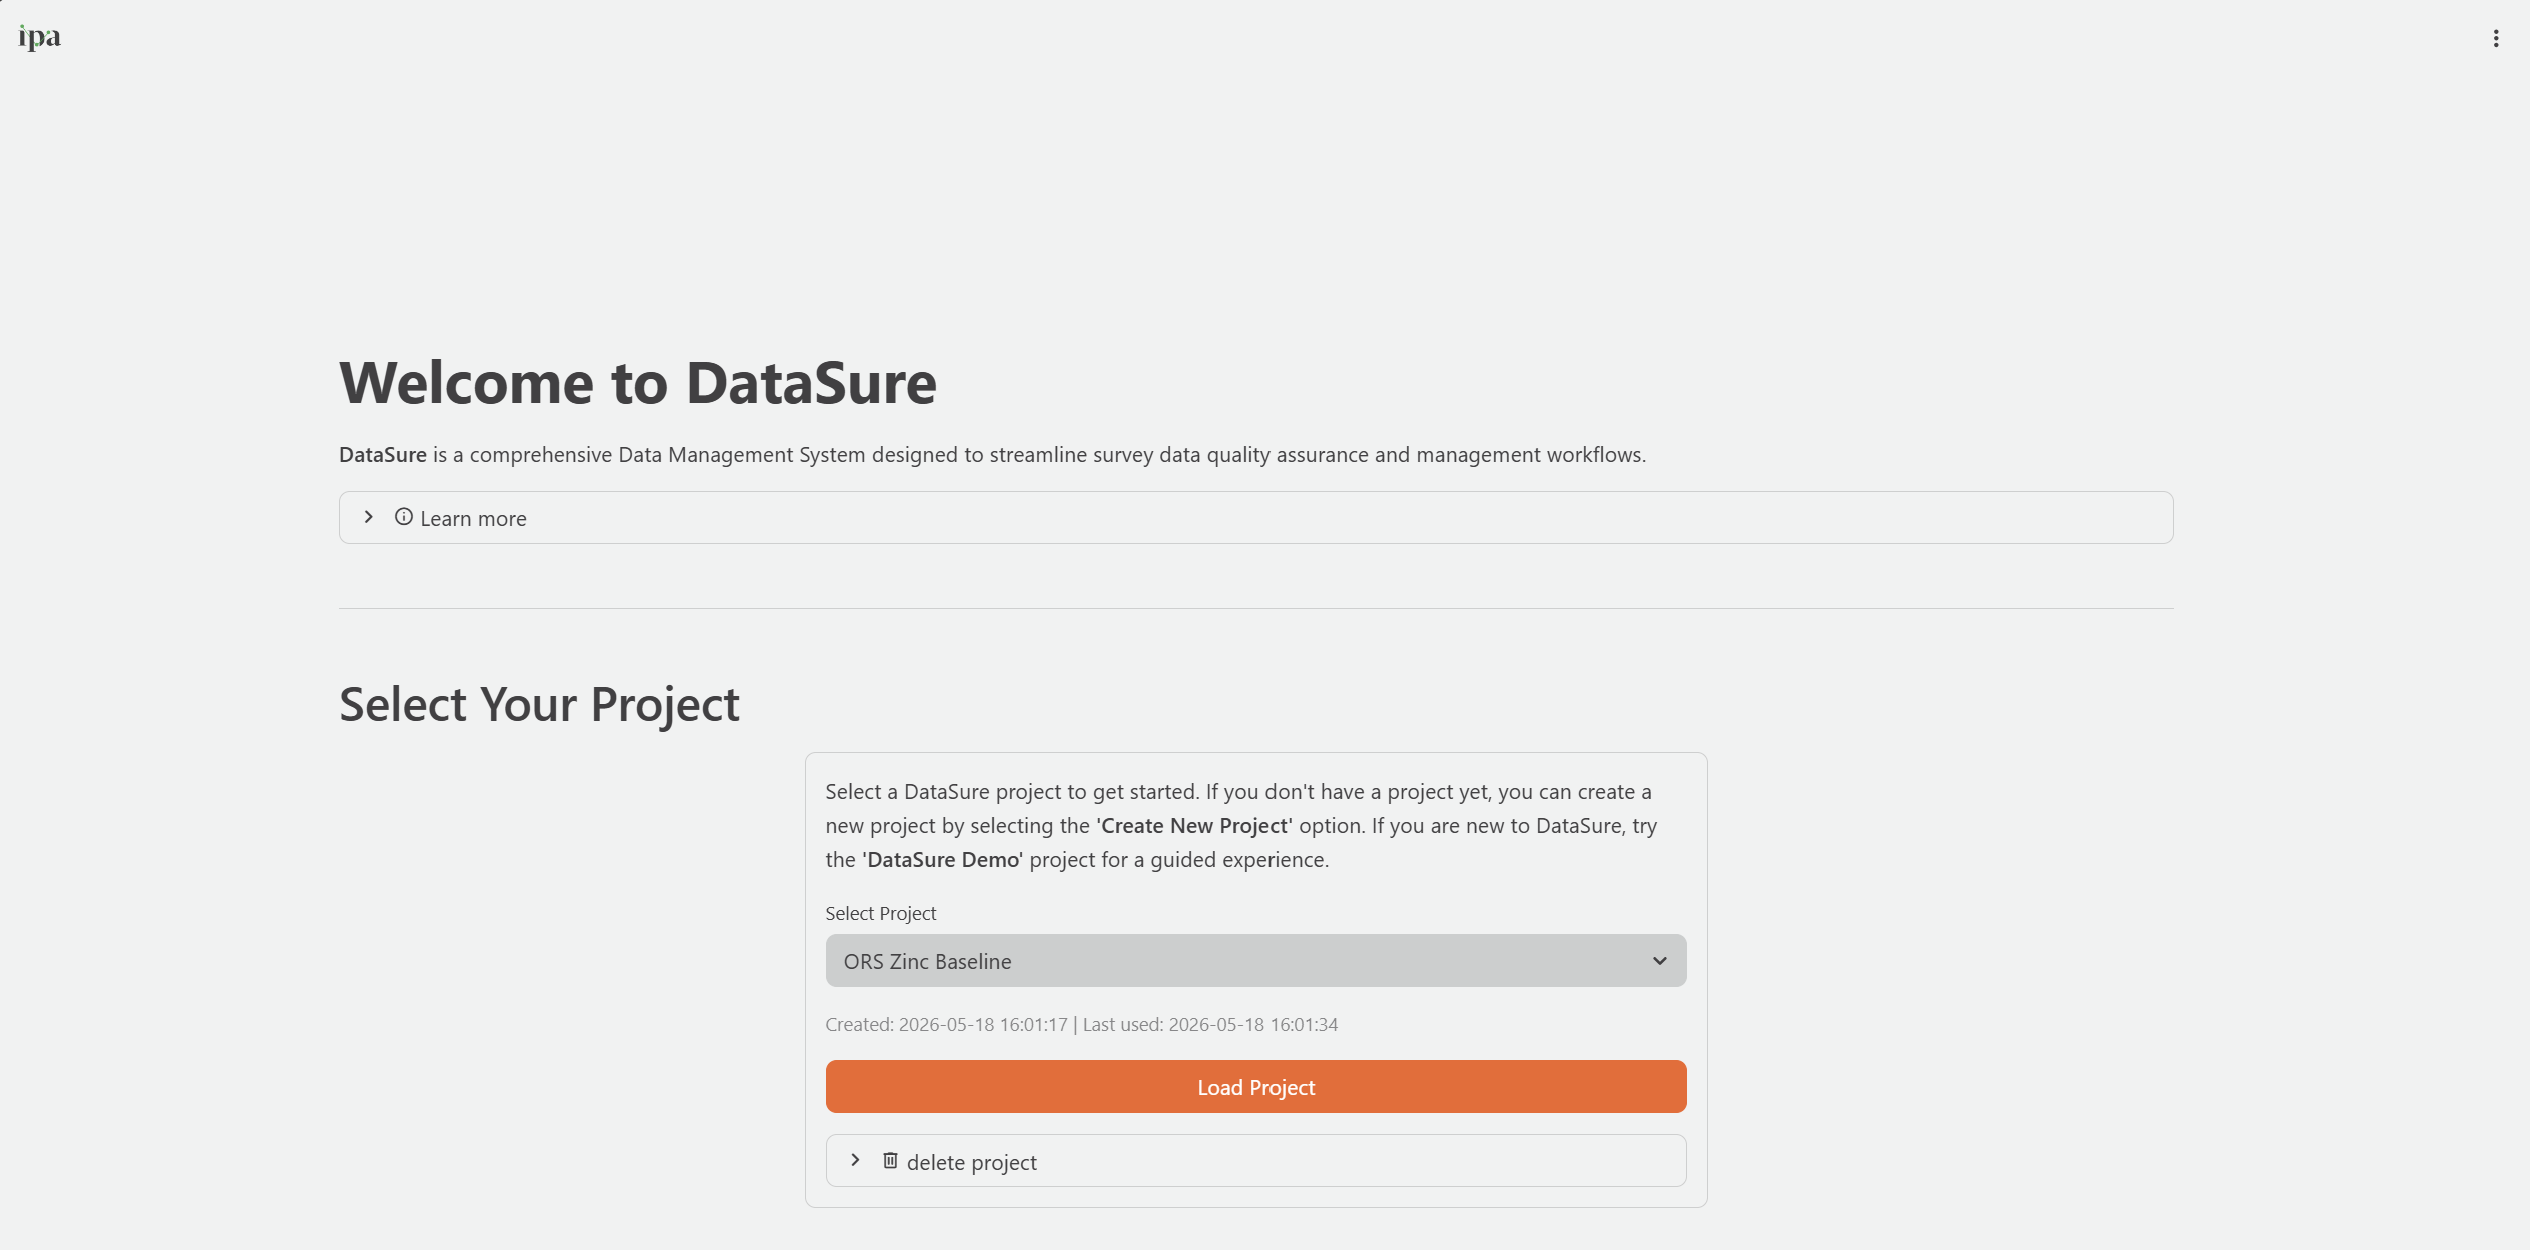
Opening an existing project
- On the Start Here page, select the project from the dropdown. DataSure automatically highlights the most recently used project.
- DataSure shows the project’s creation date and last-used date below the selector.
- Click Load Project.
Deleting a project
To permanently delete a project and all its data, expand the Delete Project section under the project selector. DataSure will ask you to confirm before deleting. This action cannot be undone.
Step 2: Import Data
DataSure supports 2 ways to get data into a project: connecting directly to a SurveyCTO server, or uploading a local file. You can import multiple datasets per project, up to 10 in total. Navigate to the Import Data page from the sidebar.
Option A: Import from SurveyCTO
Connecting to SurveyCTO is the recommended approach for active data collection. DataSure downloads submissions incrementally, meaning it only fetches new submissions since the last import rather than re-downloading the full dataset each time. This saves significant time when refreshing data during active collection.
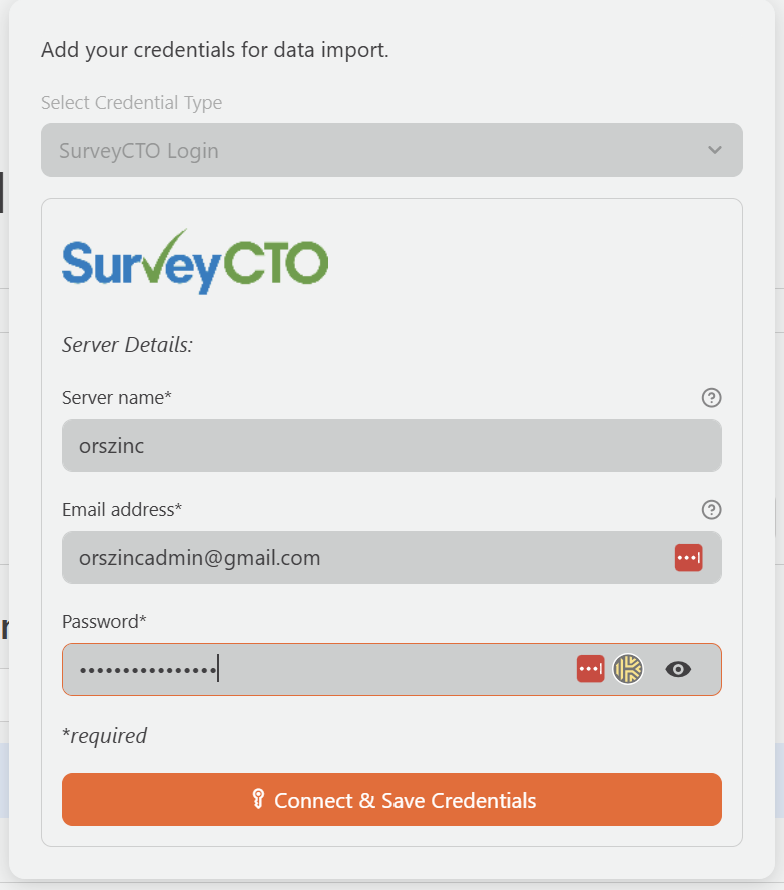
To use SurveyCTO integration, you will need your SurveyCTO server name, username, and password.
- On the Import Data page, click the SurveyCTO tab.
- Enter your server credentials:
- Server Name: The prefix of your SurveyCTO server address. For example, if your server is
yourserver.surveycto.com, enter onlyyourserver. - Username: Your SurveyCTO account username
- Password: Your SurveyCTO account password
- Server Name: The prefix of your SurveyCTO server address. For example, if your server is
- Click Connect. DataSure will retrieve the list of forms available on your server.
- Select the form or forms you want to import.
- If your form uses encryption, provide the Private key.
- Click Import Data.
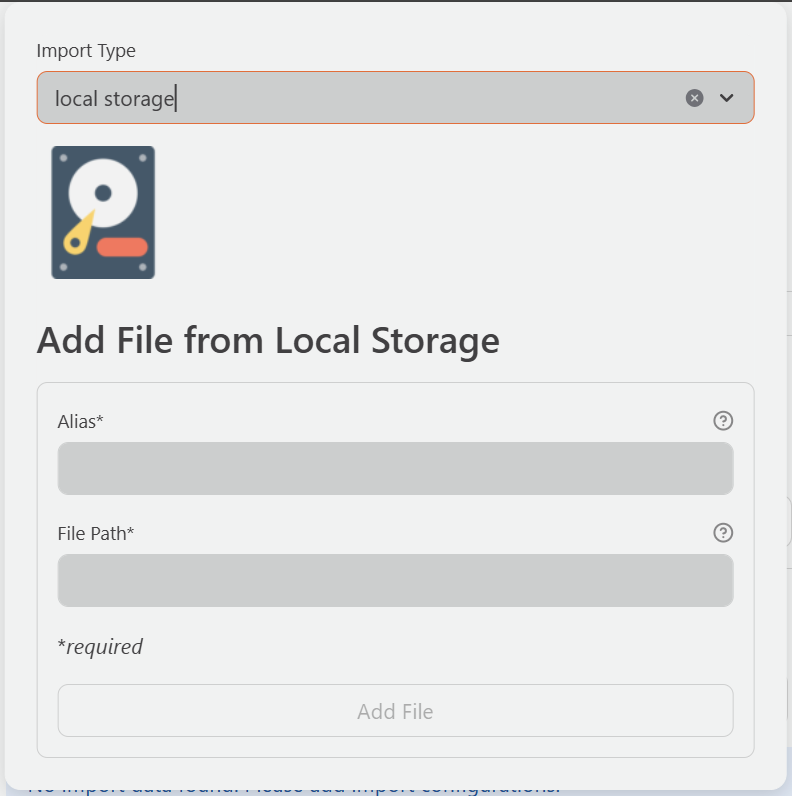
Option B: Upload a local file
DataSure accepts the following file formats: CSV - .csv, Excel - .xlsx, .xls), Stata - .dta, and JSON - .json.
On the Import Data page, click the Local Files tab.
Drag and drop your file into the upload area, or click Browse to select it.
Enter a short, descriptive alias for the dataset. The alias is how DataSure refers to this dataset throughout the application, so it should be meaningful and consistent.
Good examples:
survey,baseline_hh,backcheck_wave1For Excel files with multiple sheets, select the correct sheet from the dropdown.
Click Load Data.
Reviewing imported data
After importing, DataSure shows a preview of your dataset with column names, data types, row and column counts, and the first 100 rows. Review this preview before moving on:
- Are column names what you expect?
- Do data types look correct? Dates often import as text, and you will need to convert them in the Prepare Data step.
- Does the row count match what you expect from your server or file?
You can return to the Import Data page at any time to refresh your data from SurveyCTO or re-upload an updated file. DataSure will replace the existing version of the dataset.
If you are running backchecks, import both your survey dataset and your backcheck dataset before moving on. Give them distinct aliases, for example survey and backcheck, so they are easy to identify when configuring checks.
Step 3: Prepare Your Data
The Prepare Data page lets you clean and transform imported datasets before running quality checks. DataSure logs all preparation steps automatically and later uses them to generate Stata do-files in the Replication Package. Navigate to it from the sidebar.
Most projects need at least one preparation step: converting date columns from text to datetime format. DataSure requires date columns to be in datetime format for several quality check modules to function correctly.
Why data preparation matters
SurveyCTO data is typically well-structured because the XLS form design determines column types. Most columns arrive in the correct format and do not require transformation. However, one common exception is calculate fields: these are fields where SurveyCTO computes a value automatically - a calculated age or a score - but stores the result as a string rather than a number. If you need to use a calculate field in outlier detection or descriptive statistics, you will need to convert it to numeric using the Transform Column action.
For data imported from CSV or other flat files, you may need additional preparation, such as converting date strings to datetime format or standardizing inconsistent text casing in ID columns.
Available transformation functions
The Transform Column action supports the following functions:
| Function | What it Does | Example Use Case |
|---|---|---|
| string to datetime | Converts a text column containing date or timestamp values into a proper datetime format | Convert submissiondate from "2024-03-15 08:42:00" to a datetime value so it works correctly in date-based checks |
| string to numeric | Converts a text column containing numbers into a numeric type | Convert a SurveyCTO calculate field storing a computed score as text into a number for outlier detection |
| string to uppercase | Converts all text in a column to uppercase | Standardize an ID column where enumerators entered some values as "hh001" and others as "HH001" |
| string to lowercase | Converts all text in a column to lowercase | Normalize enumerator name entries for consistent grouping |
| extract pattern | Extracts a substring matching a regular expression from each value in a column | Extract a district code from a composite ID field |
| mathematical operation | Applies an arithmetic operation (add, subtract, multiply, divide) to a numeric column | Divide a duration column from milliseconds to seconds |
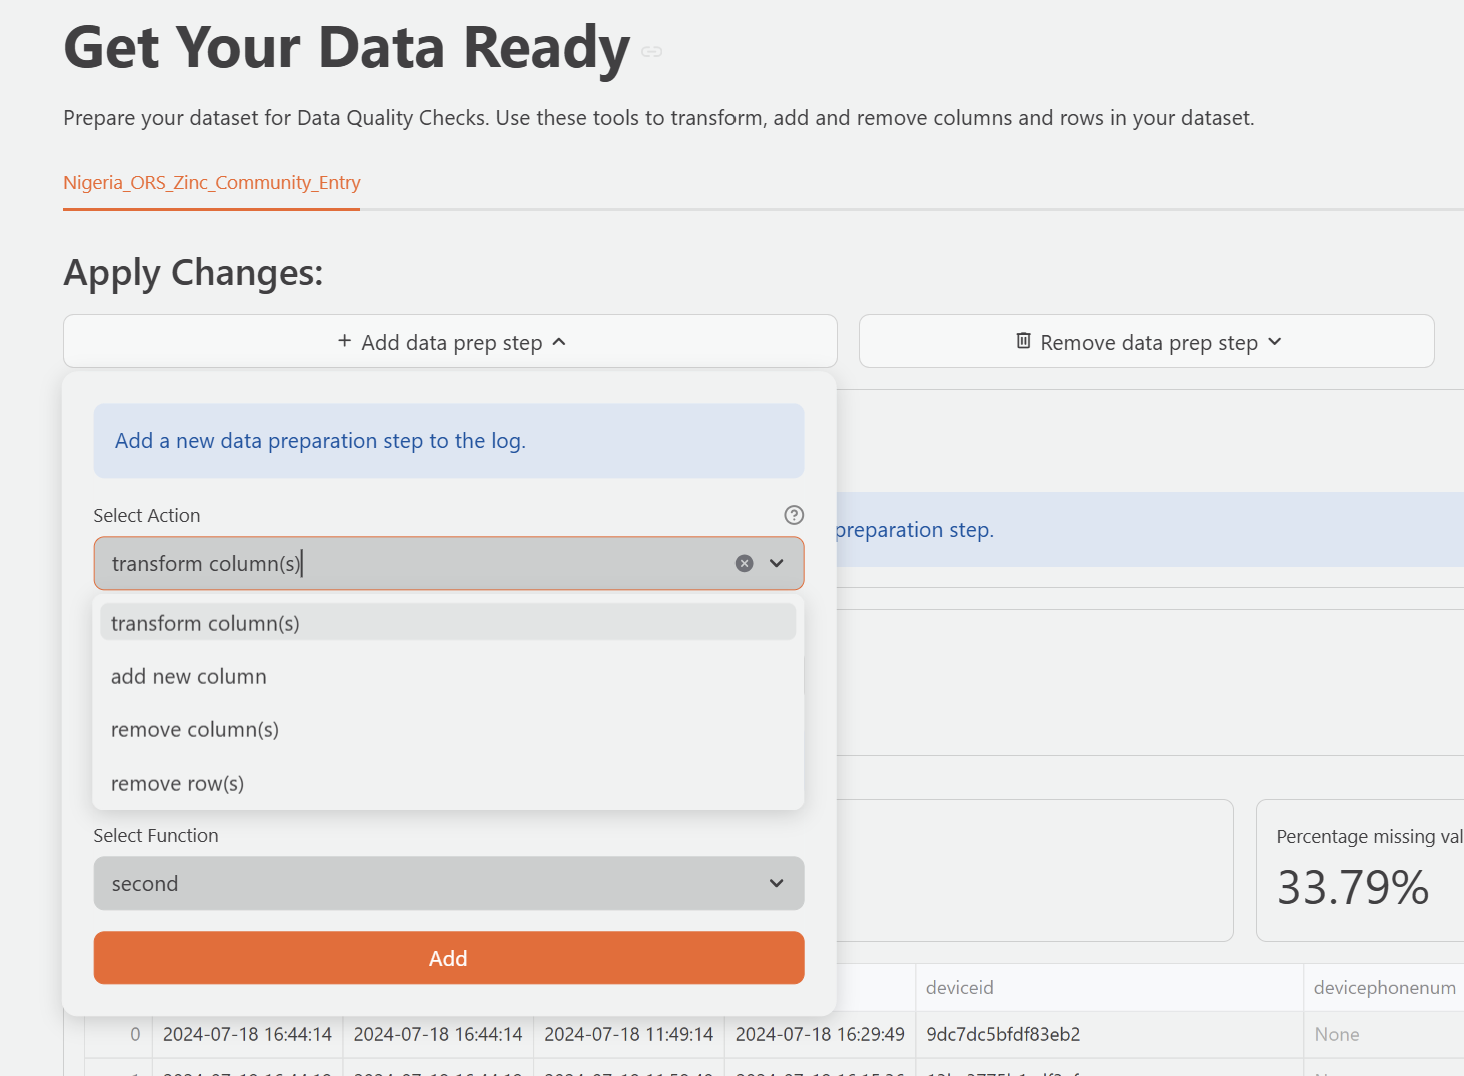
All available preparation actions
| Action | What it Does | Example Use Case |
|---|---|---|
| Transform Column | Convert or modify values in an existing column | Convert submissiondate from text to datetime; convert enum_name to uppercase |
| Add Column | Create a column, including unique identifiers | Add a UUID key column if the dataset does not have one |
| Remove Column | Delete a column from the dataset | Remove PII columns not needed for quality checks |
| Remove Row | Filter out rows matching a condition | Remove test submissions or rows with a specific flag value |
If your dataset does not have a column where every row has a unique value, use Add Column to create one before configuring checks. DataSure requires a unique key column to track individual records across all quality check modules.
Transform Column
Use Transform Column to modify values in an existing column. Select a column and a function from the dropdown. Some functions require additional parameters that appear after you select the function.
String functions
| Function | What it Does | Example |
|---|---|---|
| Trim | Remove leading and trailing whitespace from string values | Clean up extra spaces in manually entered enumerator names |
| Substring | Extract a portion of a string by start position and length | Extract the first 3 characters of a district code |
| Replace | Replace all occurrences of a target string with a new string | Replace "N/A" with an empty string |
| Strip | Remove all occurrences of a specified character from a string | Strip hyphens from a formatted phone number |
| To Lowercase | Convert all string values to lowercase | Normalize enumerator name entries |
| To Uppercase | Convert all string values to uppercase | Standardize ID column values for consistent matching |
| String to Number | Convert string values to numeric | Convert a calculate field stored as text to an integer or float |
| String to Date | Convert string values to date format | Convert "2024-01-15" stored as text to a date column |
| String to Datetime | Convert string values to datetime format | Convert submissiondate stored as text to a datetime column for trend analysis |
| Extract Pattern | Extract substrings matching a regular expression pattern | Pull a numeric code from a compound string like "HH-042-K" |
| Get Dummies | One-hot encode categorical string values into binary indicator columns | Expand a region column into separate region_North, region_South columns |
Numeric functions
| Function | What it Does | Example |
|---|---|---|
| Add | Add a constant value to every row | Add an offset to correct a systematic entry error |
| Multiply | Multiply every value by a constant | Convert a distance column from km to m |
| Subtract | Subtract a constant value from every row | Subtract a baseline offset from a numeric response |
| Divide | Divide every value by a constant | Convert duration from milliseconds to seconds |
| Round | Round values to a specified number of decimal places | Round GPS accuracy to two decimal places |
| Floor | Round values down to the nearest integer | Truncate fractional ages to whole years |
| Ceiling | Round values up to the nearest integer | Round up partial interview counts |
| Absolute Value | Replace each value with its absolute value | Remove negative signs from response differences |
Datetime functions
These functions extract a component from a datetime column and return it as a new numeric value in the same column.
| Function | What it Returns | Example |
|---|---|---|
| Second | Second component (0–59) | Extract the seconds component from a timestamp |
| Minute | Minute component (0–59) | Extract the minute of submission for time-of-day analysis |
| Hour | Hour component (0–23) | Extract submission hour to identify peak collection hours |
| Day of Month | Day of the month (1–31) | Extract the calendar day from submissiondate |
| Day of Week | Day of the week (0=Monday, 6=Sunday) | Identify which day of the week interviewers conducted interviews |
| Day of Year | Day of the year (1–366) | Calculate cumulative collection day within a year |
| Date | Extract the date portion only (removes time) | Strip the time component from a datetime column |
| Week of Year | Week number within the year (1–53) | Group submissions by collection week |
| Month of Year | Month number (1–12) | Extract the month of data collection |
| Quarter of Year | Quarter (1–4) | Group submissions by quarter |
| Year | Four-digit year | Extract the year from a multi-year dataset |
Add Column
Use Add Column to create a new column in your dataset. Select a method and configure any required parameters.
| Method | What it Does | Example |
|---|---|---|
| Constant | Add a column where every row has the same fixed value | Add a country column with value "Kenya" for all rows |
| Sum | Add a column with the row-wise sum of selected columns | Sum multiple expenditure columns into a total_expenditure column |
| Mean | Add a column with the row-wise mean of selected columns | Average multiple food security scores into a composite index |
| Median | Add a column with the row-wise median of selected columns | Compute the median of repeated measurement columns |
| Min | Add a column with the row-wise minimum of selected columns | Record the lowest value across multiple numeric columns |
| Max | Add a column with the row-wise maximum of selected columns | Record the highest value across multiple numeric columns |
| Standard Deviation | Add a column with the row-wise standard deviation | Measure variability across repeated responses |
| Variance | Add a column with the row-wise variance | Compute variance across repeated measurements |
| First | Add a column with the first non-null value across selected columns | Retrieve the first available response from a set of fallback columns |
| Last | Add a column with the last non-null value across selected columns | Retrieve the most recent value from a set of columns |
| Count | Add a column with the count of non-null values across selected columns | Count how many modules a respondent completed |
| Count Unique | Add a column with the count of unique values across selected columns | Count distinct responses across repeated-choice columns |
| Product | Add a column with the row-wise product of selected columns | Multiply unit price and quantity to compute total value |
| Difference | Add a column with the row-wise difference between two columns | Compute the gap between endline and baseline scores |
| Quotient | Add a column with the row-wise quotient of two columns | Divide a total score by maximum possible to compute a proportion |
| Index | Add a column containing the row number (0-based integer index) | Add a row number for reference when there is no existing unique identifier |
| UUID | Add a column of randomly generated universally unique identifiers | Generate a key column when the dataset has no unique row identifier |
| Random | Add a column of random numbers drawn from a uniform distribution | Generate a random assignment or sampling variable |
Remove Column
Use Remove Column to delete one or more columns from the dataset. Select the column or columns to remove from the list.
Removing a column is a preparation step that runs before checks. Removing a column that you later need for check configuration will require you to delete the step and re-add it.
Remove Row
Use Remove Row to filter out rows that match a condition. Select a column, a condition, and any required values.
Conditions
| Condition | What it Does | Example |
|---|---|---|
| Missing | Keep only rows where the column value is null or empty | Remove rows where submission date is empty |
| Not Missing | Keep only rows where the column value is not null | Remove rows where respondent ID is missing |
| Equal To | Keep only rows where the value equals a specified value | Remove rows where is_test == 1 |
| Not Equal To | Keep only rows where the value does not equal a specified value | Retain only consented interviews where consent != 0 |
| Greater Than | Keep only rows where the value is greater than a threshold | Remove rows where duration > 7200 (more than 2 hours) |
| Less Than | Keep only rows where the value is less than a threshold | Remove rows where duration < 60 (less than one minute) |
| Greater Than or Equal To | Keep only rows where the value is greater than or equal to a threshold | Retain rows where age >= 18 |
| Less Than or Equal To | Keep only rows where the value is less than or equal to a threshold | Remove rows where progress_pct <= 0 |
| Between | Keep only rows where the value falls within a specified range (inclusive) | Retain rows where duration is between 180 and 3,600 seconds |
| Not Between | Keep only rows where the value falls outside a specified range | Remove rows where age is not between 15 and 65 |
| Like | Keep only rows where the string value matches a pattern ie. case-insensitive substring match | Remove rows where enum_name contains "test" |
| Not Like | Keep only rows where the string value does not match a pattern | Retain rows where status does not contain "draft" |
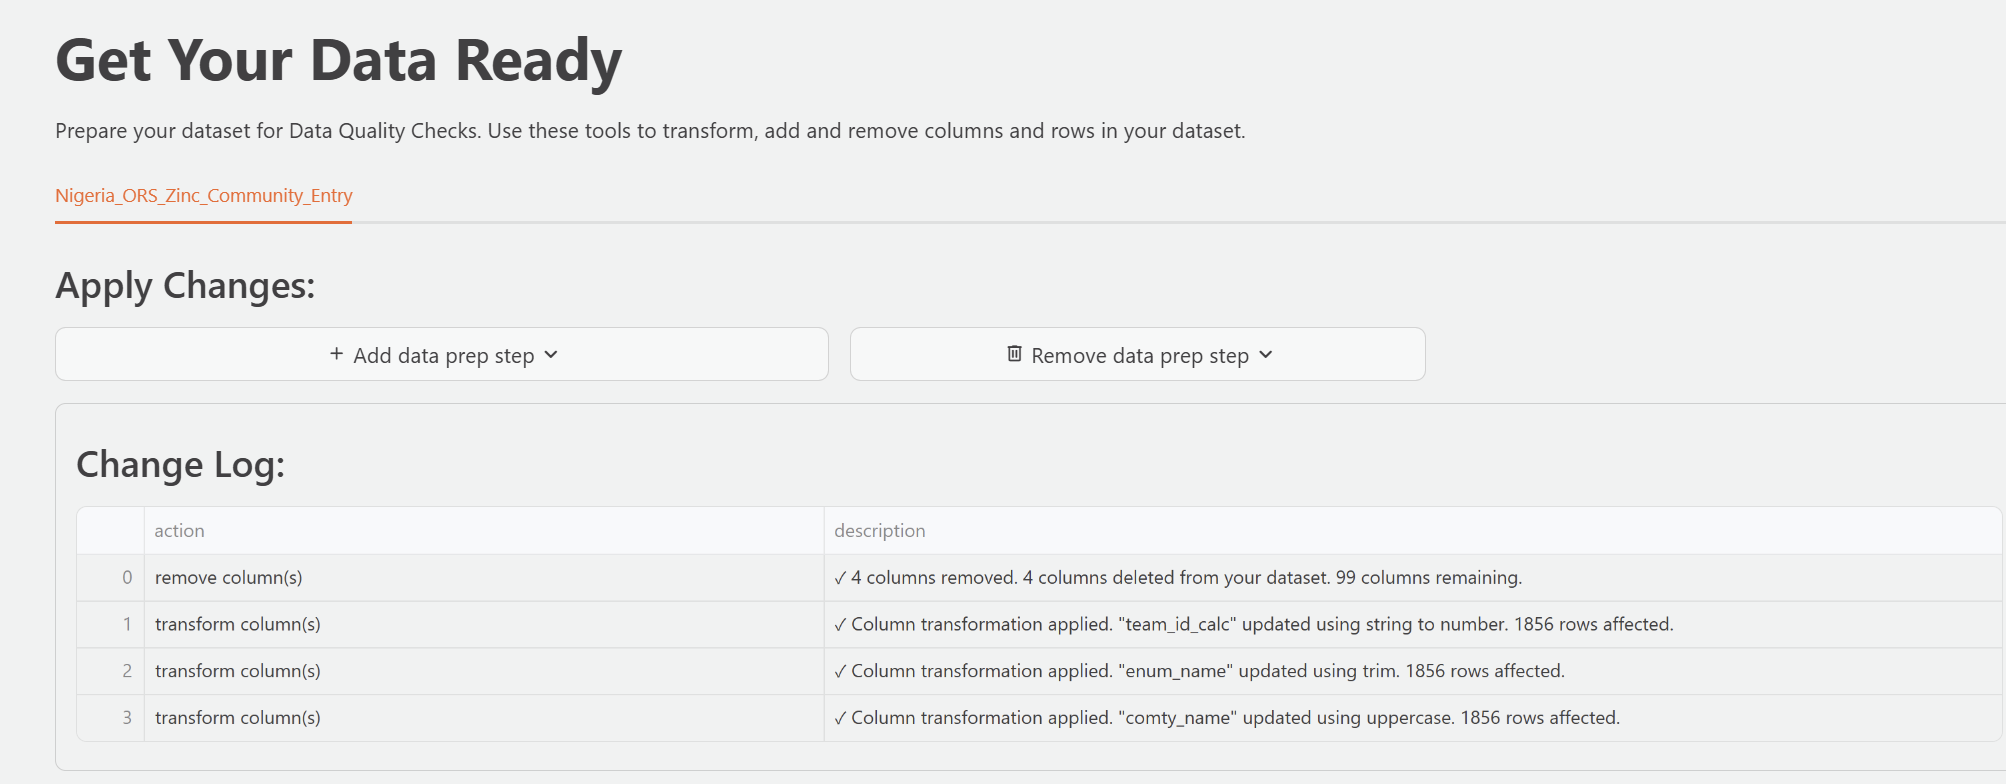
Reviewing and editing preparation steps
DataSure shows all preparation steps you add in a log below the dataset preview. Each step records the action type, the affected column, and the time you applied it. You can review this log to confirm that DataSure applied each step correctly.
DataSure applies preparation steps in order. If you need to remove a step, you can delete it from the log.
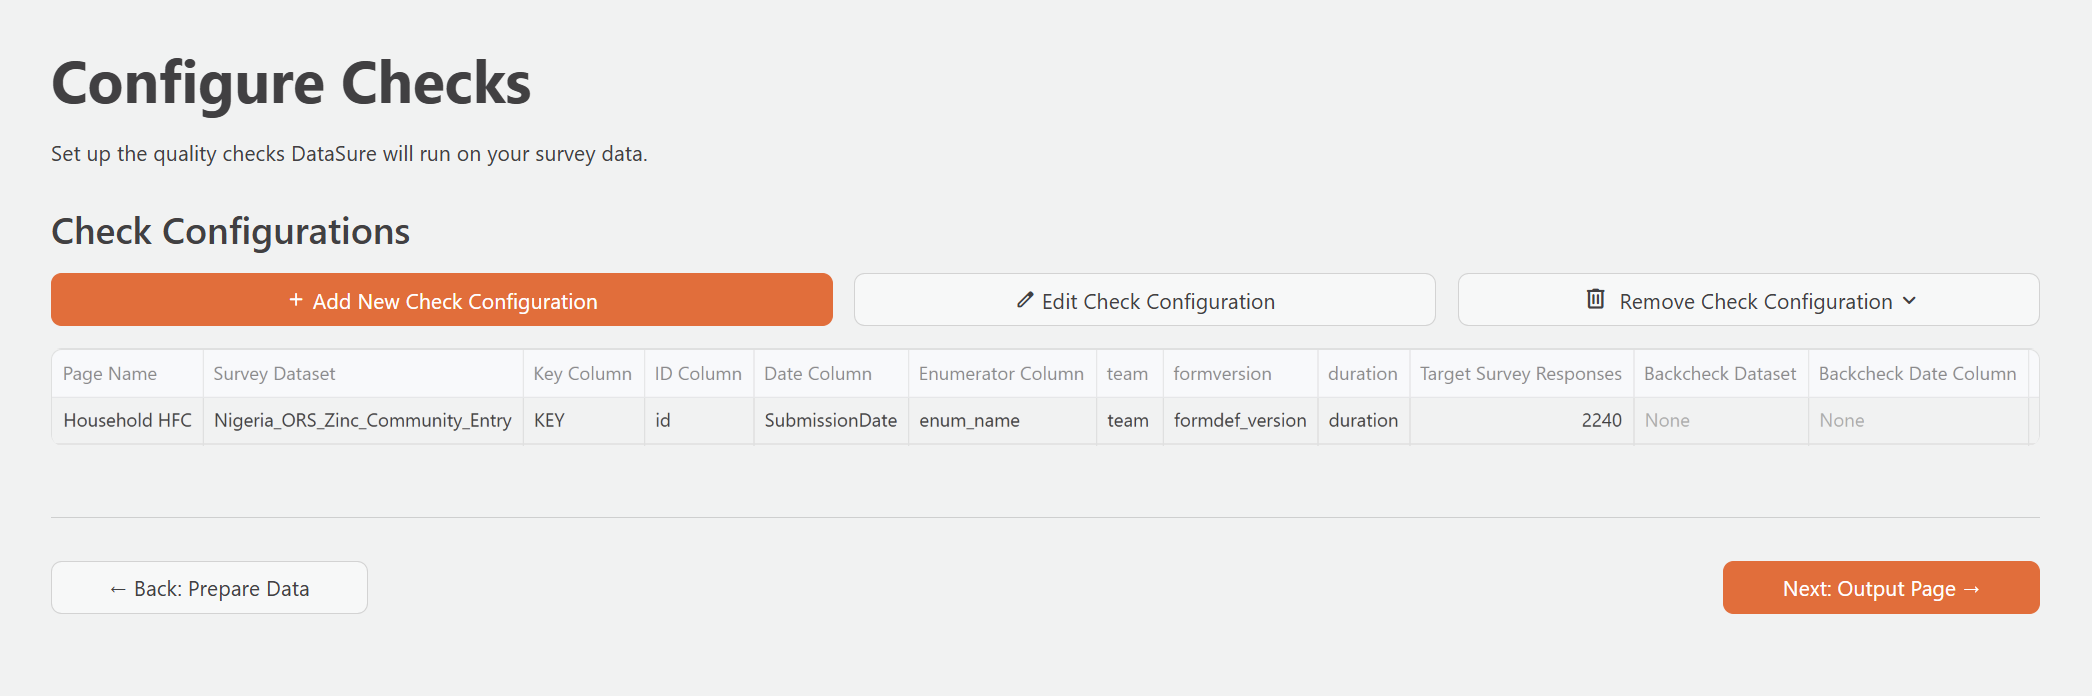
Step 4: Configure Quality Checks
The Configure Checks page is where you tell DataSure which dataset to analyze and how the columns in your dataset map to the identifiers DataSure needs to run its checks. Each configuration you create becomes a separate DQA Report page in the sidebar.
Navigate to Configure Checks from the sidebar.
Creating a check configuration
- Click Add New Check Configuration.
- Enter a Page Name for this configuration. This becomes the label for the DQA Report page in the sidebar. Keep it descriptive but concise, for example:
Household HFCsorMidline Survey Checks. The name must be between 1 and 20 characters. - Select your Survey Dataset from the dropdown. This should be the main survey dataset you imported.
- Configure the column fields as described in the sections below.
- Click Submit to create the configuration.
DataSure validates your inputs when you submit. If any required fields are missing or column selections are invalid, it will show a specific error message.
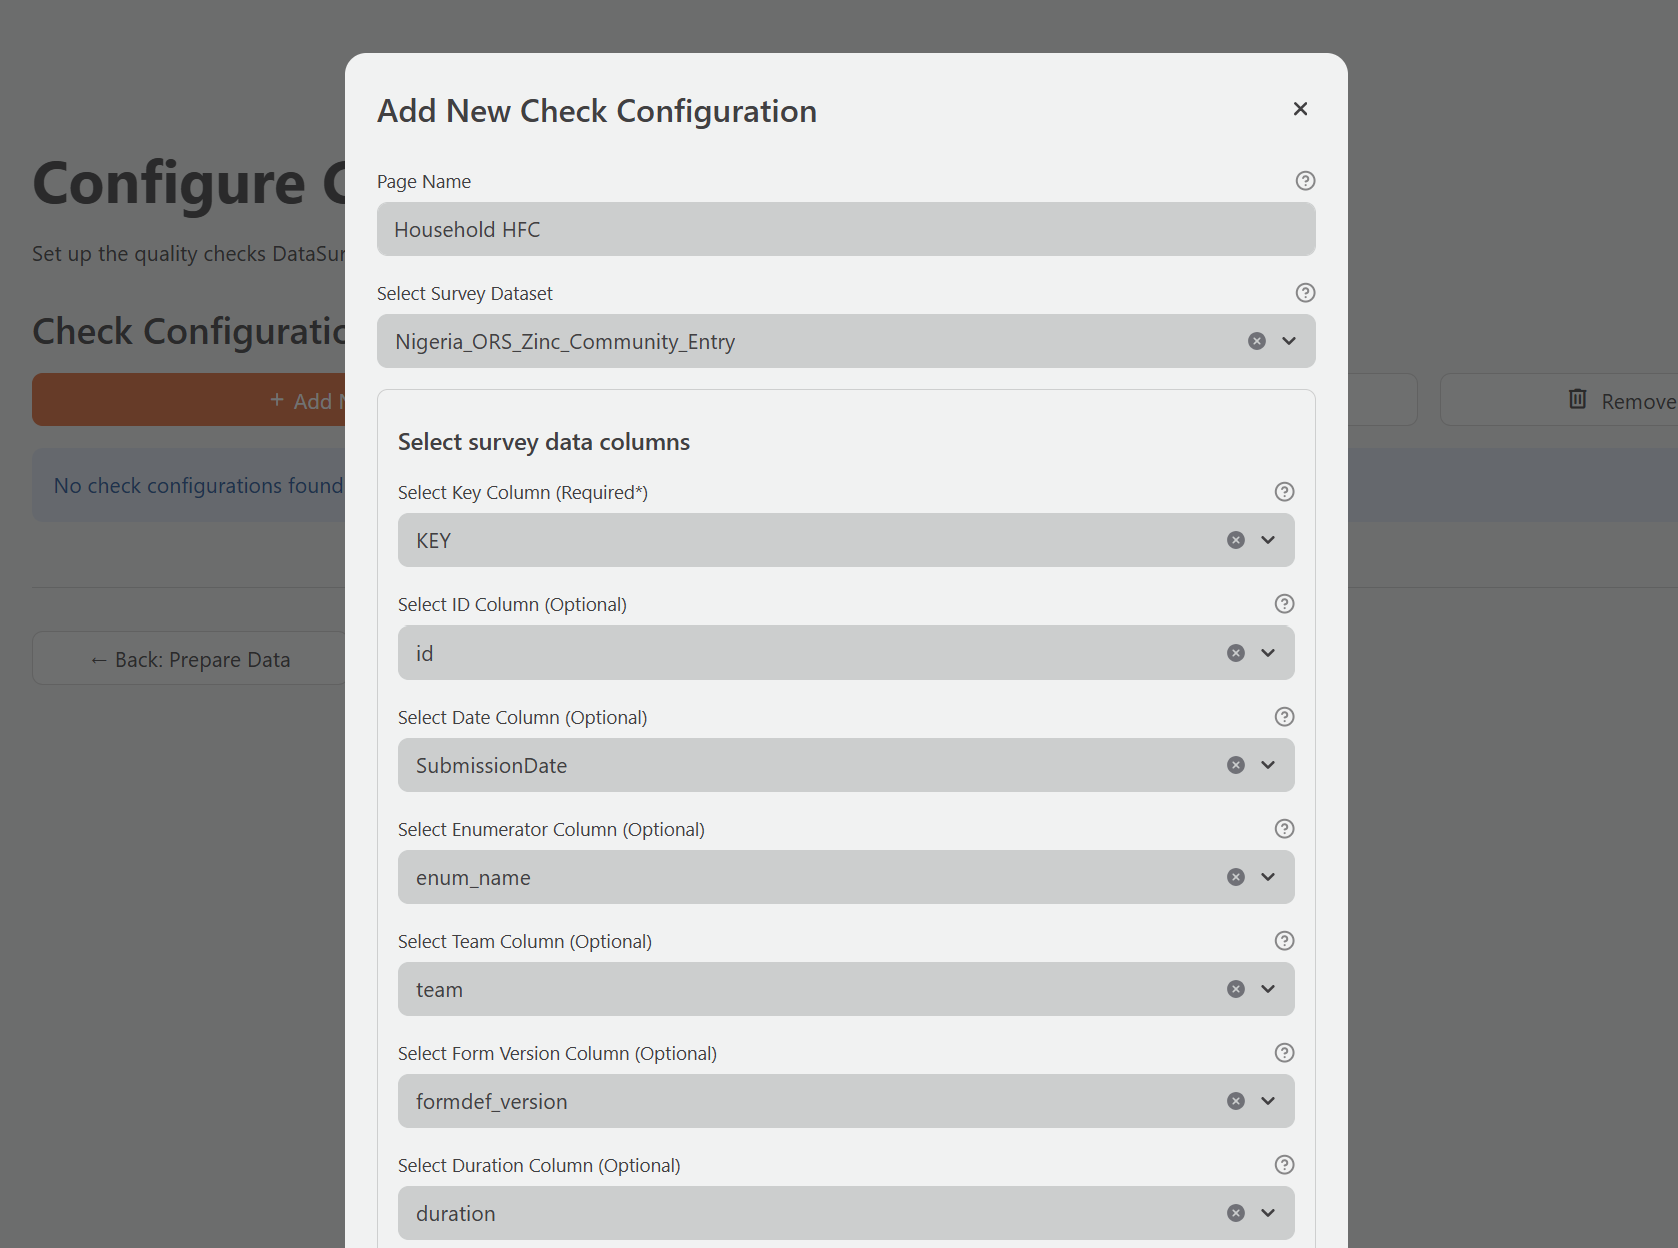
Survey columns
You must provide only the Key Column. All other columns are optional, but omitting them will disable the checks that depend on them. The table below describes each column field and which modules it affects.
| Field | Required | What It Represents | Affected Checks | Example Values |
|---|---|---|---|---|
| Key Column | Yes | A column where every single row has a unique value. Used to identify specific records for corrections and to track flagged issues across check modules. | All modules | KEY, uuid, _uuid |
| ID Column | No | The respondent identifier. May repeat if the same respondent appears in multiple rows. Without it, duplicate detection and back check matching are unavailable. | Duplicates, Back Checks, Survey Progress | hhid, respondent_id, hh_id |
| Enumerator Column | No | Identifies the field staff member who collected each record. Without it, all enumerator-level breakdowns are unavailable. | Enumerator Stats, Missing Data (by enumerator), Outliers (by enumerator) | enum_name, enumerator_id, interviewer |
| Date Column | No | The date and time when an enumerator submitted the survey or conducted the interview. Must be in datetime format. Without it, all time-based charts and trends are unavailable. | Summary, Survey Progress, Enumerator Stats, Missing Data (over time) | submissiondate, starttime, date_collected |
| Team Column | No | Identifies the team or group the enumerator belongs to. When provided, Enumerator Stats adds team-level breakdowns alongside individual breakdowns. | Enumerator Stats | team_id, supervisor_name, region_team |
| Duration Column | No | The interview duration, typically in seconds. SurveyCTO records this automatically in a column called duration. Without it, duration statistics are unavailable. |
Enumerator Stats | duration, interview_duration |
| Form Version Column | No | The survey form version used for each submission. SurveyCTO stores this as formdef_version. Without it, the Summary tab omits form version tracking. |
Summary | formdef_version, form_version |
| Survey Target | No | The expected total number of completed interviews. Without it, progress charts display submission trends but without a target reference line. | Summary, Survey Progress | 200, 500, 1500 |
The Key Column and ID Column serve different purposes. The Key Column must be unique for every row, like a UUID generated per submission. The ID Column identifies the respondent and may appear more than once if the same person participated in multiple survey occasions.
Backcheck dataset (optional)
If you have imported a backcheck dataset, you can link it to this configuration to enable the Back Checks module.
- Select your Backcheck Dataset from the dropdown.
- Configure the backcheck columns:
| Field | What It Represents | Example Values |
|---|---|---|
| Backcheck Date Column | The date of the re-interview | submissiondate, bc_date |
| Backchecker Column | The identifier of the person conducting the re-interview | bcer_name, backchecker_id |
| Backchecker Team Column (optional) | The team the backchecker belongs to | team_id, bc_team |
| Target Percentage (optional) | The target proportion of interviews to backcheck, as a percentage | 10 for 10% |
The backcheck dataset must share the same ID column as the main survey dataset so that DataSure can match survey records to their corresponding re-interview records.
Editing and removing configurations
To edit an existing configuration, click Edit Check Configuration and select the configuration to modify. To delete a configuration, click Remove Check Configuration. Removing a configuration also removes its DQA Report page from the sidebar, but does not delete the underlying data.
Step 5: Review Your DQA Reports
After saving a check configuration, a DQA Report page appears in the sidebar with the name you gave the configuration. This is where you review the results of all nine quality check modules.
Navigate to your DQA Report from the sidebar. Reports update automatically each time you import new data. During active data collection, review them at least once per day.
Navigating check tabs
Each DQA Report page has nine tabs, one for each quality check module. Each tab has two sections:
- Settings: Configure display options and thresholds for that specific check. DataSure saves these settings and keeps them across sessions, so you do not need to reconfigure them each time.
- Results: The actual check output, including summary statistics, charts, and tables of flagged records.
Use the Column Selector within each tab to choose which columns to include in that check. This is useful for focusing on the variables most relevant to your project.
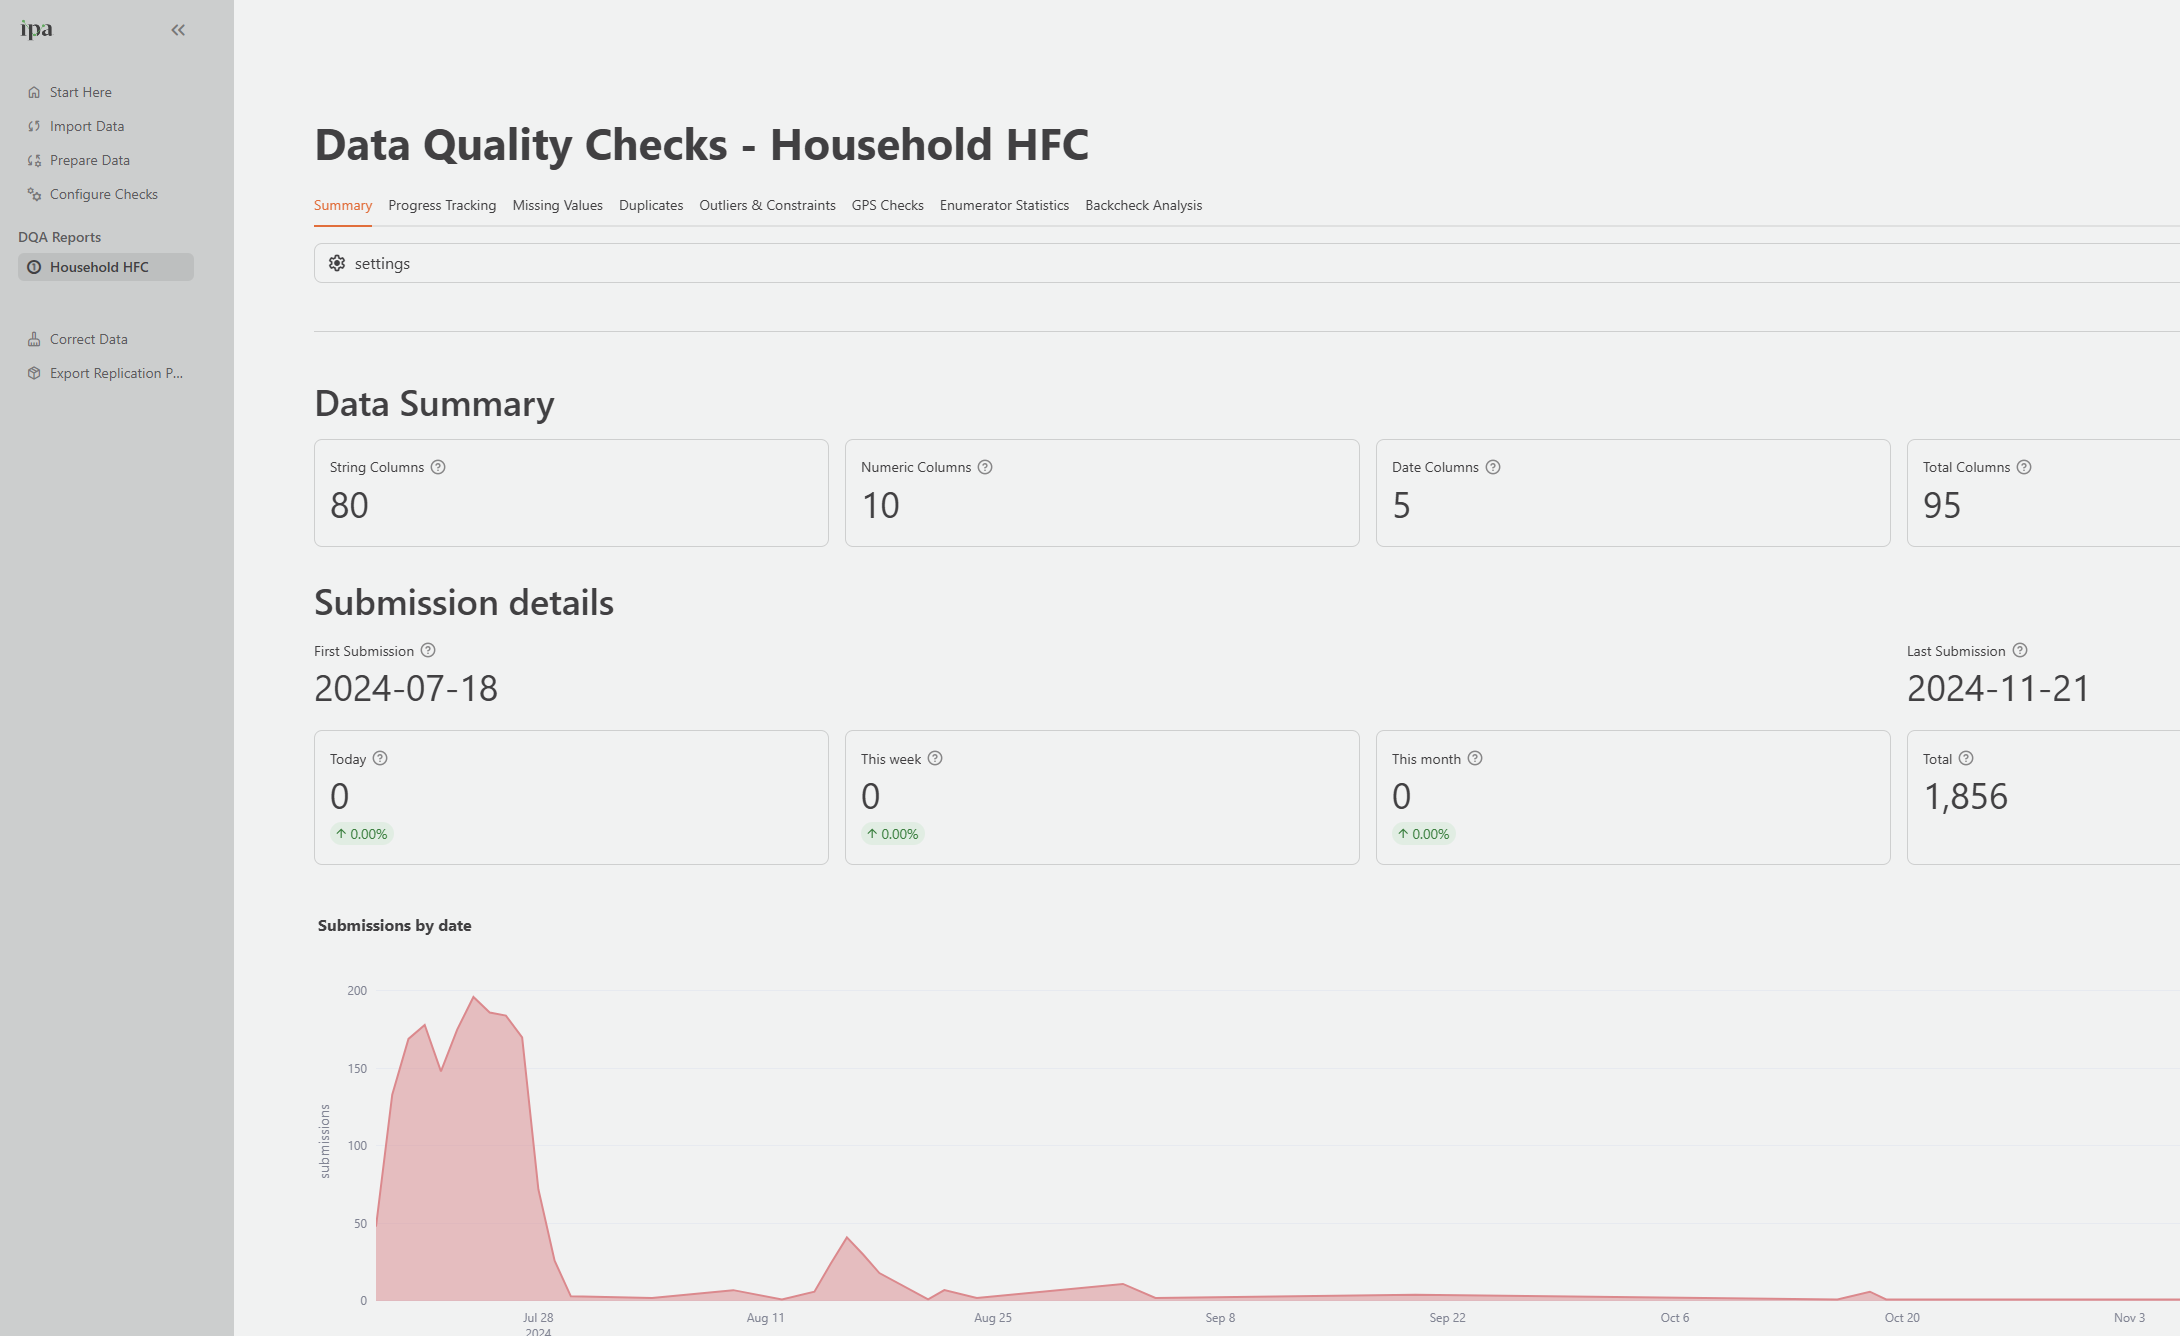
Summary tab
The Summary tab is the starting point for each monitoring session. It gives a high-level picture of your data collection at a glance.
Key metrics shown:
- Submission totals: Total interviews today, this week, this month, and all time
- Submission trend: A line chart showing submissions over time, so you can spot slowdowns or unusual spikes
- Progress bar: Percentage toward your Survey Target (if configured), with average daily submission rate
- Data quality overview: At-a-glance percentages for duplicate rate, outlier rate, missing data rate, and backcheck error rate
- Subgroup progress: Progress broken down by a grouping variable you choose, such as region or enumerator team
Survey Progress tab
The Survey Progress tab provides a more detailed view of collection pacing. It is most useful for project managers who need to monitor whether the team is on track to meet the target sample size by the end of the data collection period.
Configure the tab settings before reviewing results:
- Select the Survey ID, Date, and Enumerator columns
- Enter the Target Number of Interviews
- Optionally, specify Consent and Completion columns and their expected values (for example,
consent = "yes"andcompletion_status = "complete")
The tab then shows submission trends, attempt rates per respondent, and consent and completion rates over time.
![]()
Duplicates tab
The Duplicates tab identifies records that share the same value in columns that should be unique.
Configure the tab settings:
- Select the Survey ID column (the respondent identifier to check for duplicates)
- Optionally add other columns to check, such as phone numbers or national ID numbers
The results show the total number of duplicates found, which columns have duplicates, and a table listing every duplicate record. You can filter the table to focus on specific columns.
When you identify a duplicate to resolve, use the Correct Data page (Step 6) to either modify the incorrect ID or remove the duplicate record.
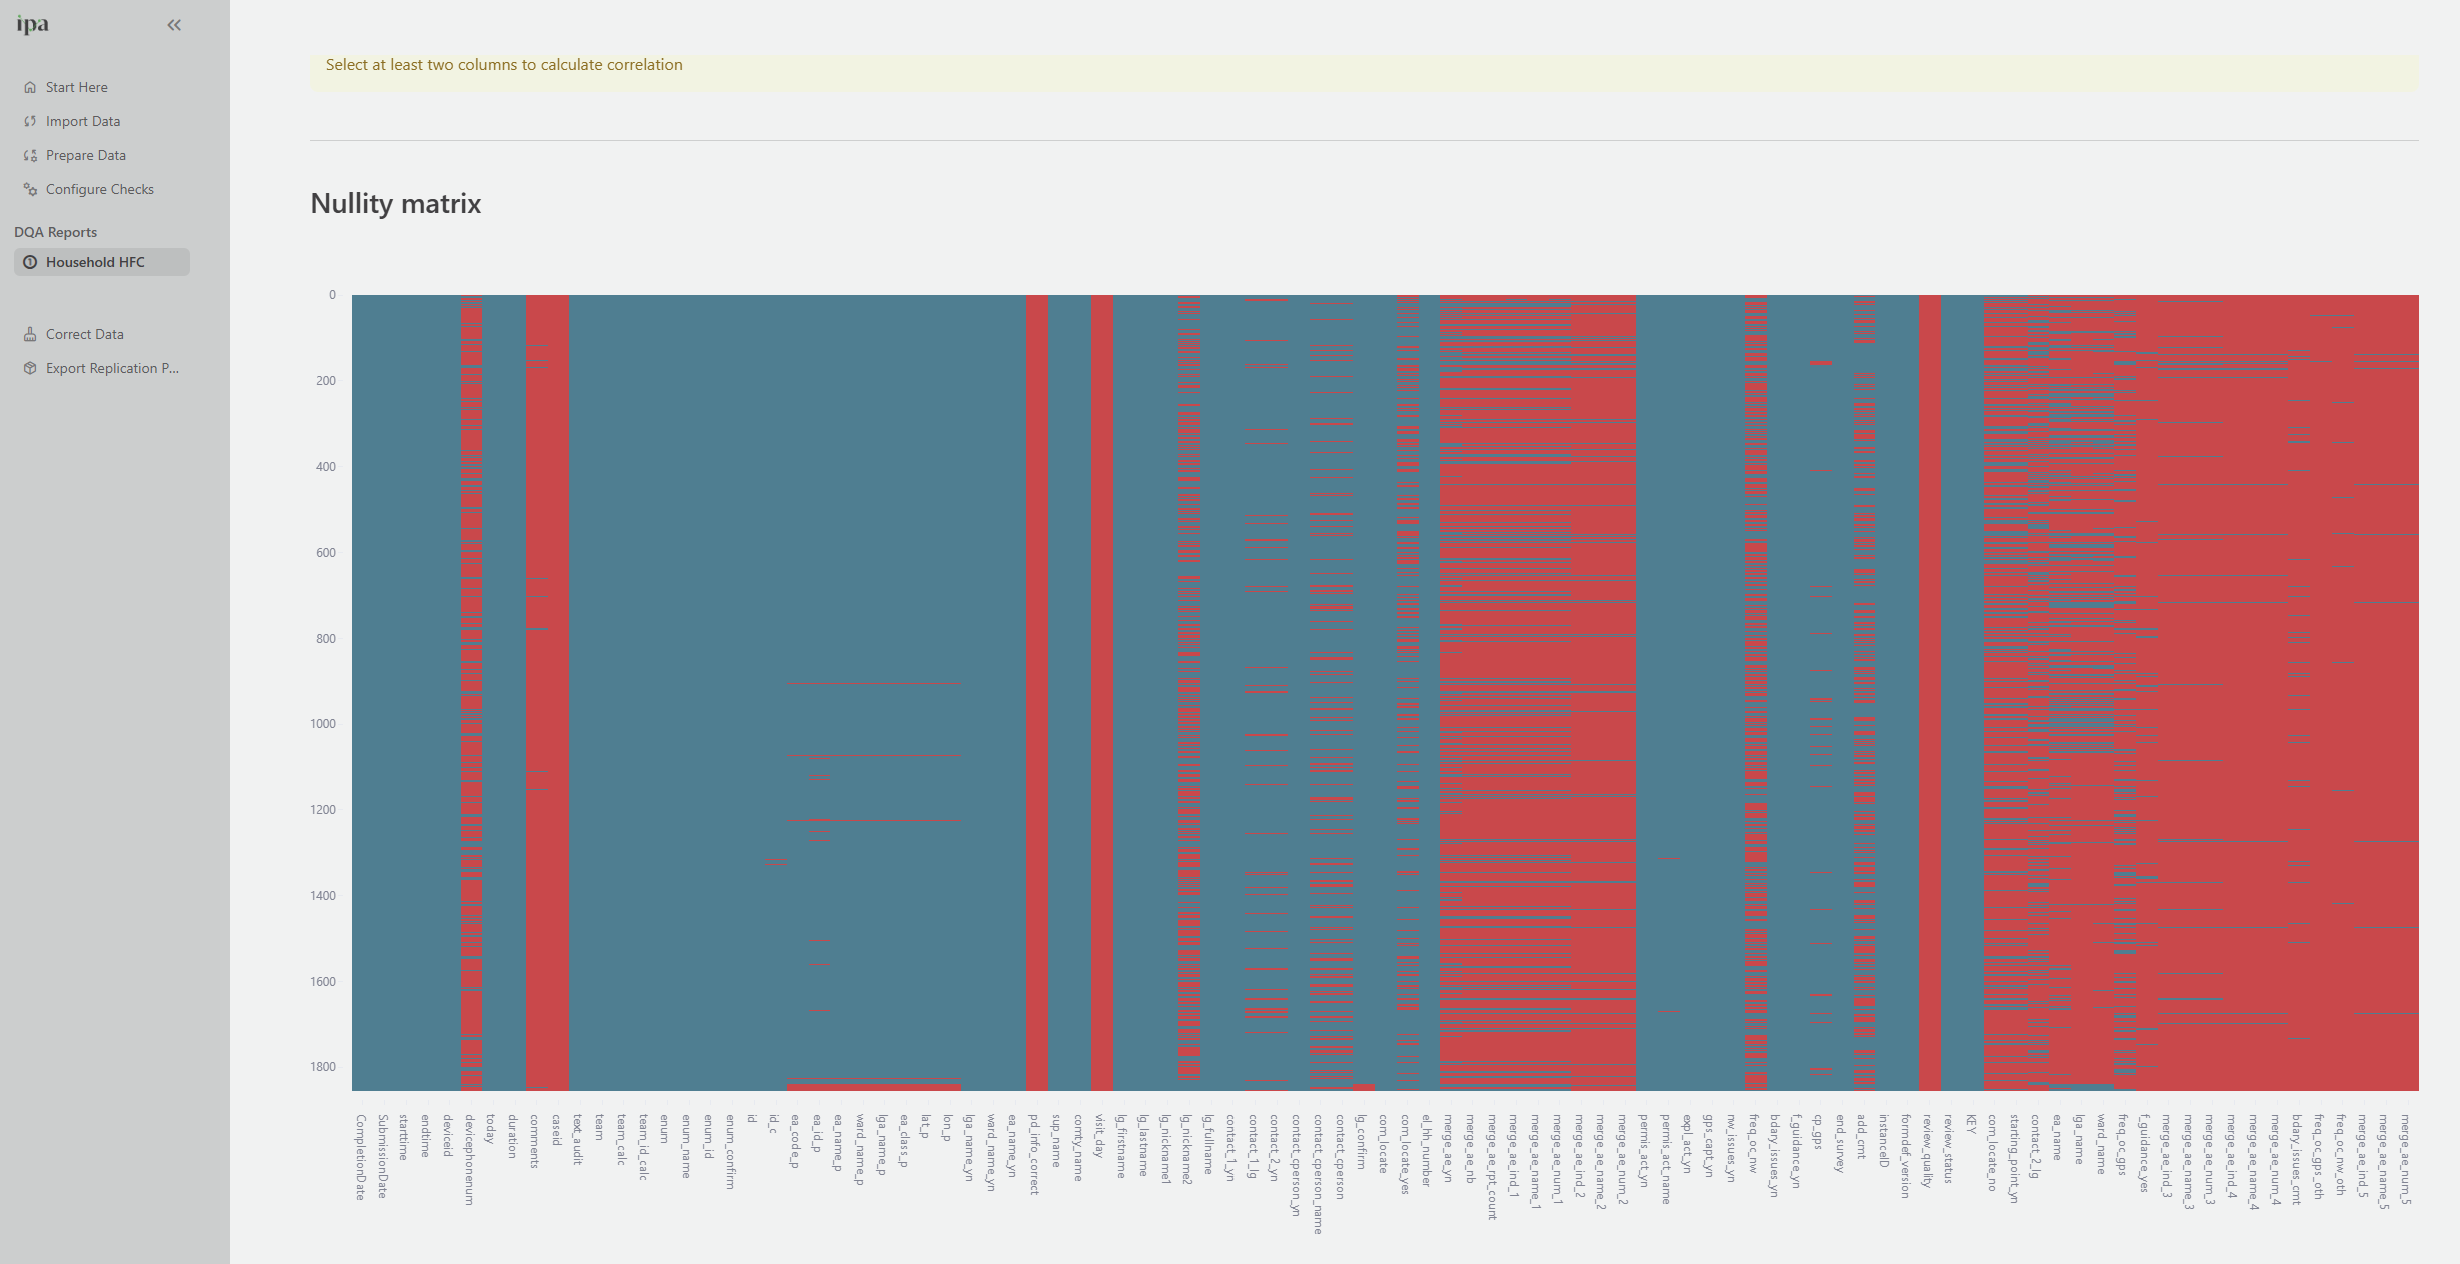
Missing Data tab
The Missing Data tab shows the extent and patterns of incomplete responses across your dataset.
Before reviewing results, configure your missing value codes:
- Missing Labels: Names for categories of missing responses, such as
Don't Know,Refused,Not Applicable - Missing Codes: The numeric codes used in the dataset to represent these categories, such as
-99,-88,-77. Separate multiple codes with commas.
The tab then shows:
- Overall and per-column missing rates
- A breakdown by category (null, Don’t Know, Refused, Not Applicable)
- Missing rates grouped by enumerator or other categorical variable
- Missingness over time (to detect when problems started)
- A nullity matrix: a visual grid where each row is a record and each column is a variable, with missing values shown in red. This is useful for spotting systematic patterns, such as when respondents skip an entire block of questions.
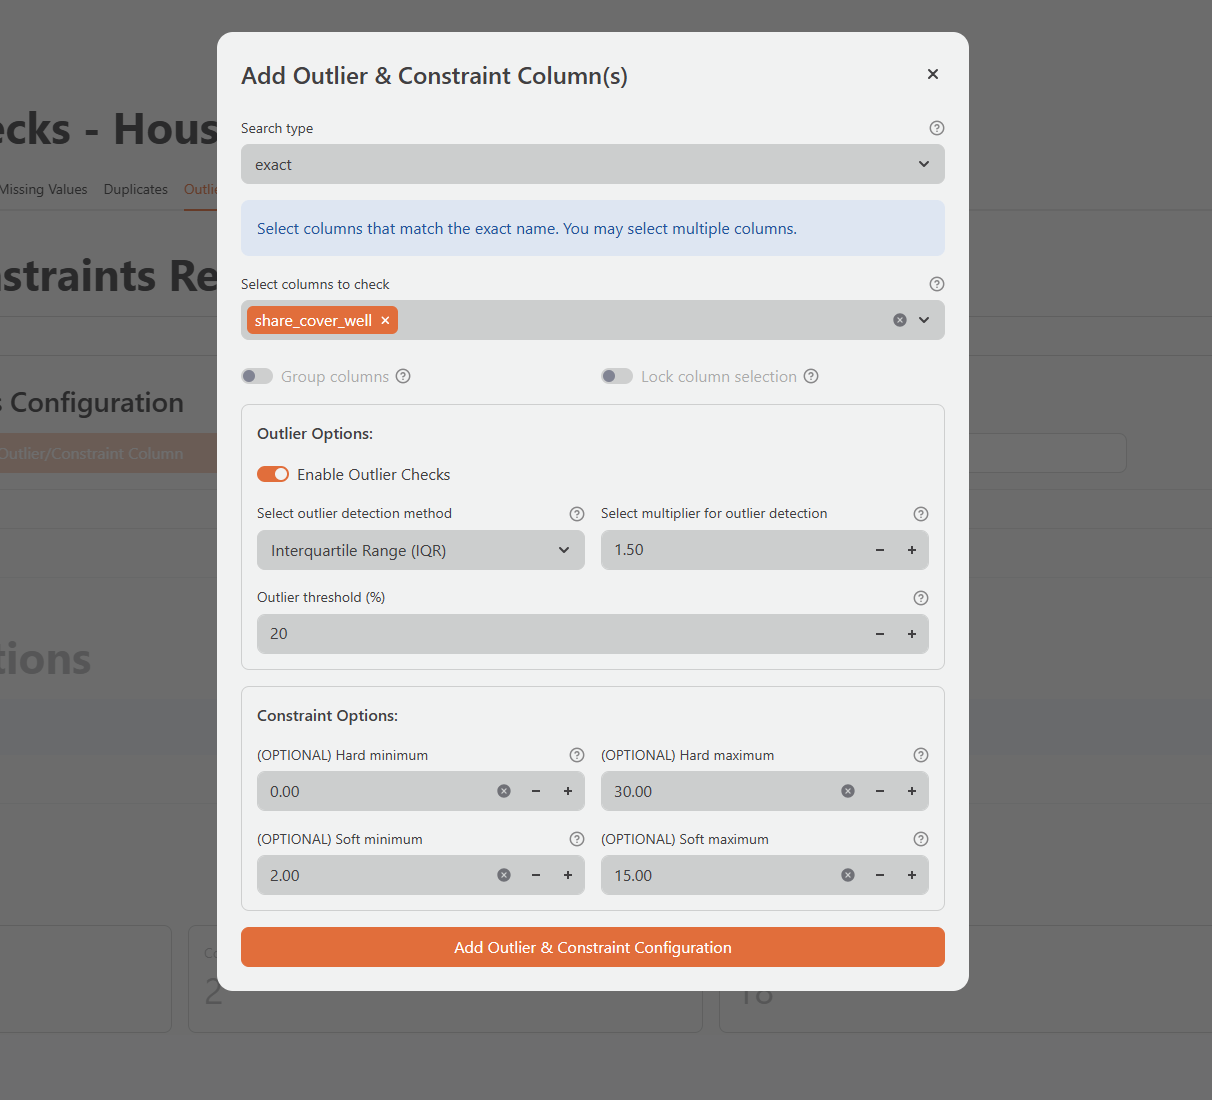
Outliers tab
The Outliers tab flags numeric values that are statistically unusual and may indicate data entry errors or implausible responses.
The tab requires additional setup before showing results. Click Add Outlier Column for each numeric variable you want to check:
Select Columns: Choose the column or columns to check. You can search by exact name or by pattern:
exact: Match specific column names, for exampleland_acrecontains: Match any column containing a substring, for exampleincomewill matchhh_income,farm_income,total_incomestartswith/endswith: Match by prefix or suffixregex: Use a regular expression pattern
Detection Method: Choose how the tool identifies outliers:
- IQR (Interquartile Range): The default method. Flags values more than 1.5 times the IQR above the 75th percentile or below the 25th percentile. Robust to extreme values and recommended for most survey data.
- Standard Deviation: Flags values more than 3 standard deviations from the mean. More sensitive; suitable when the data is approximately normally distributed.
Multiplier: Adjust the sensitivity threshold. Lower values (for example, IQR multiplier of 1.0) flag more records; higher values flag fewer. Start with the default and adjust based on domain knowledge.
Soft Minimum / Soft Maximum (optional): Set known valid ranges for a variable. The tool flags any value below the soft minimum or above the soft maximum as an outlier regardless of the statistical threshold. For example, land area should always be greater than 0, and age should be between 15 and 95.
The results show a summary table with outlier counts and statistics per column, and a record-level table listing each flagged value and why the tool flagged it. Clicking on a column shows a box plot with outliers highlighted.
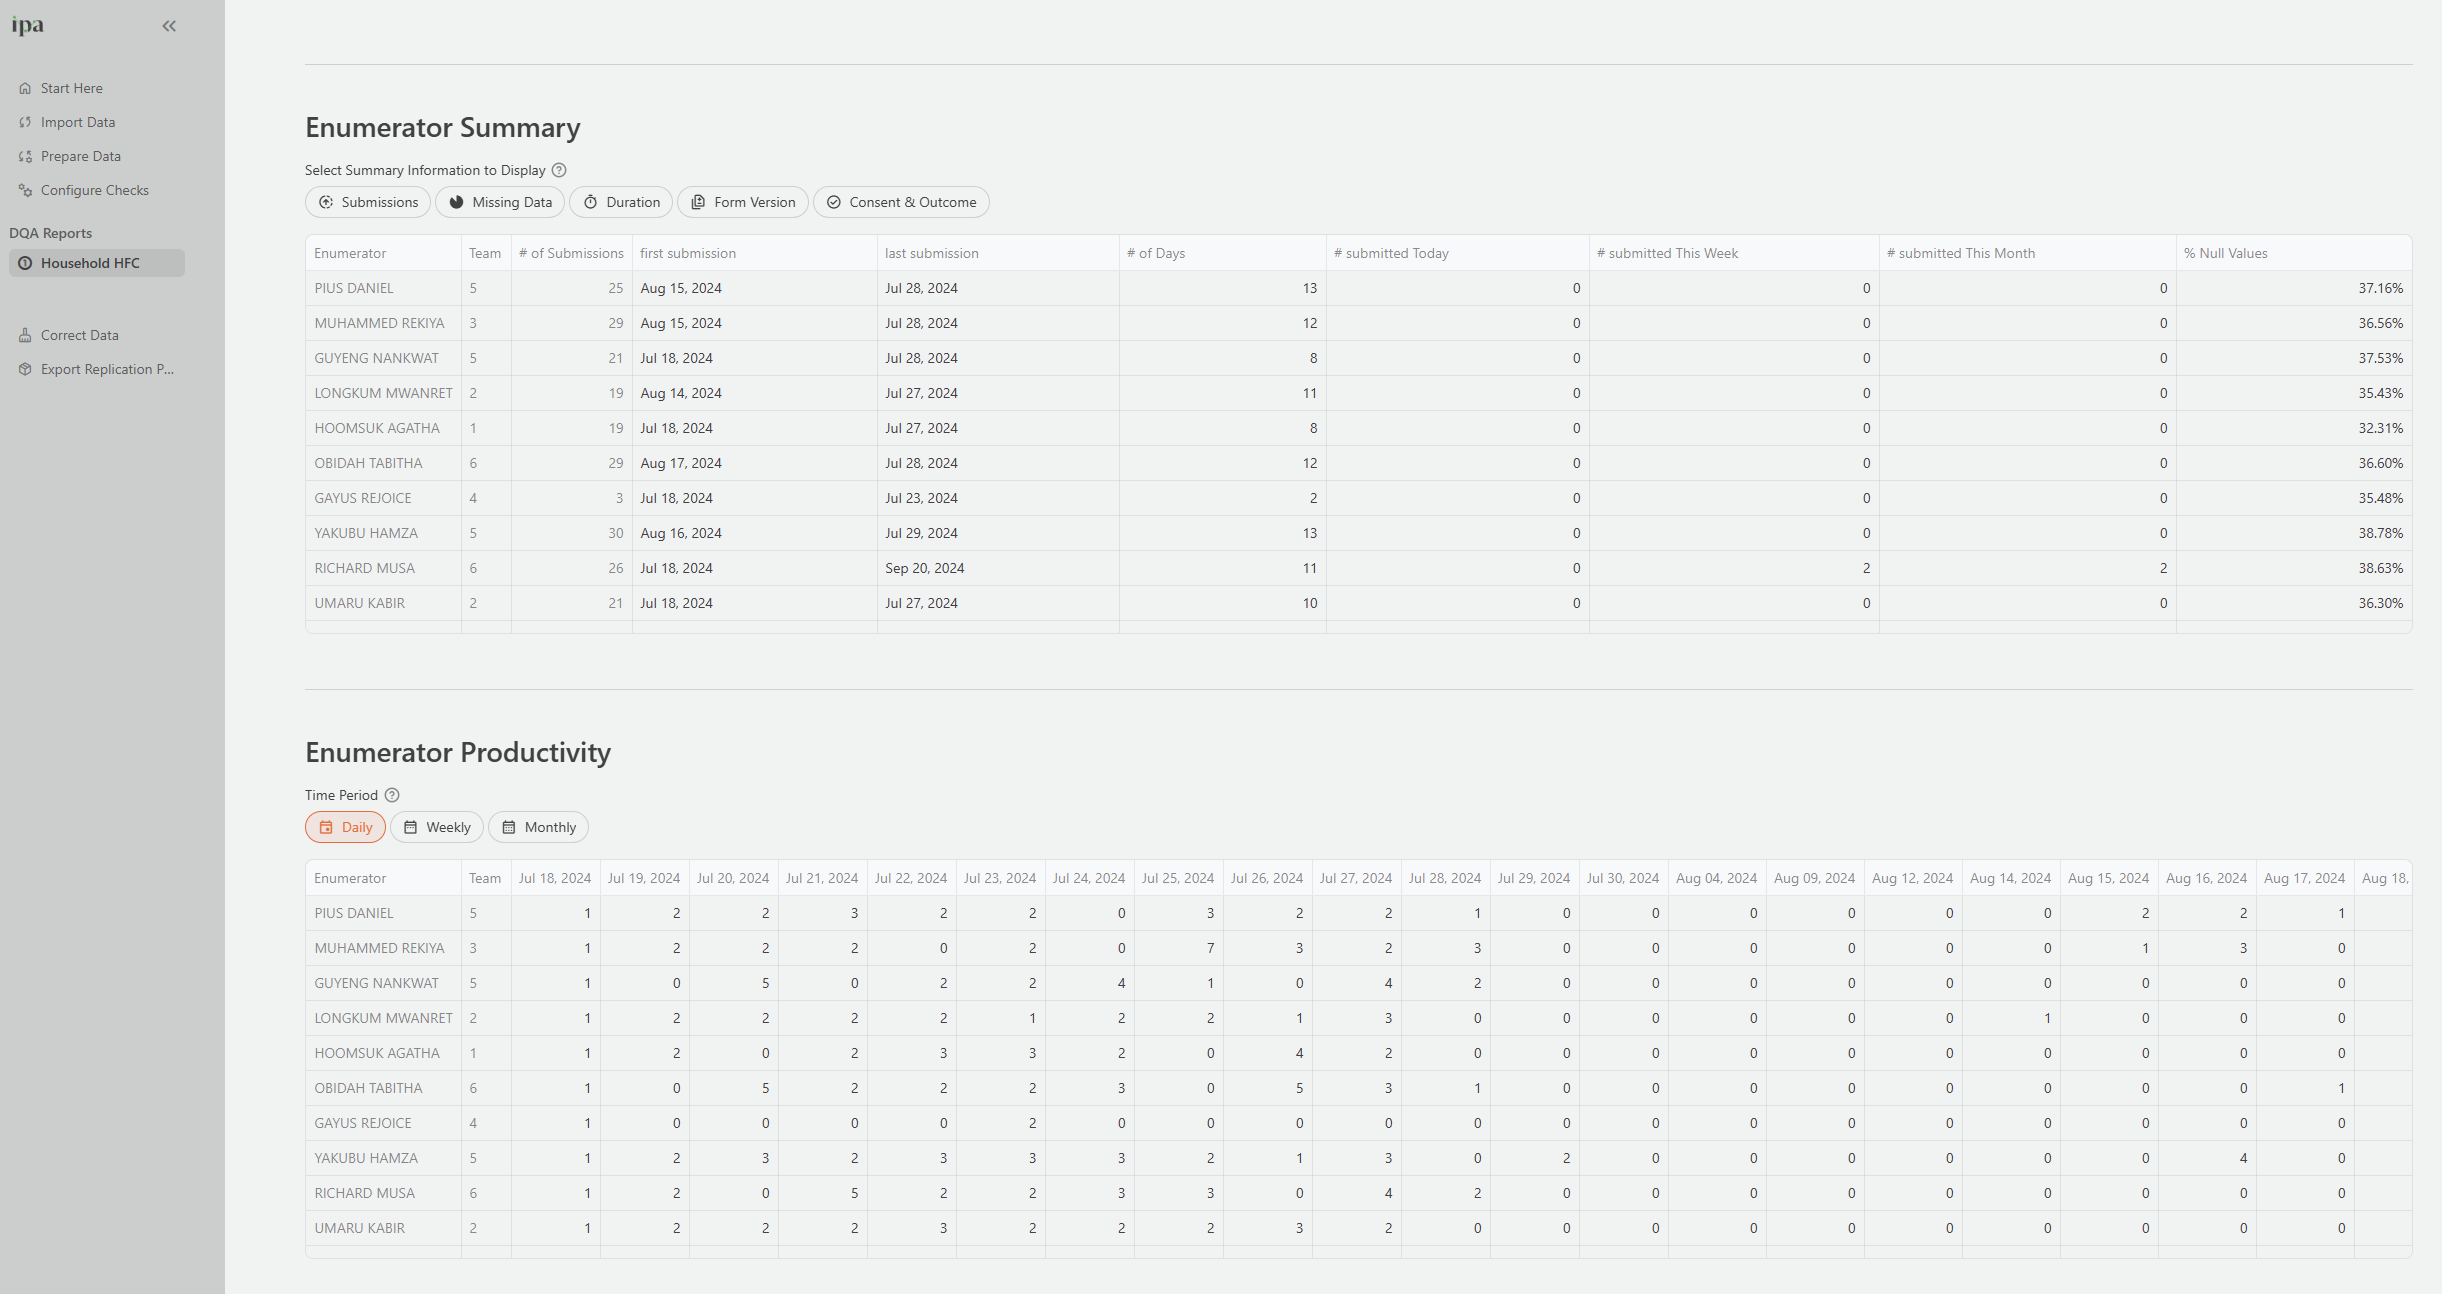
Enumerator Stats tab
The Enumerator Stats tab monitors the productivity and data quality of individual field staff. It is one of the most actionable tabs during active data collection because it helps you identify which enumerators need follow-up.
Configure the tab settings to map your dataset’s columns to the expected fields (Enumerator, Date, Duration, Team, etc.).
The tab shows:
- Overview metrics: Total enumerators, active enumerators in the past 7 days, and submission range across enumerators
- Enumerator summary table: Per-enumerator statistics including total submissions, active days, missing value rates, mean and median interview duration, and consent and completion rates
- Productivity heat map: A grid showing how many interviews each enumerator completed per day. This makes it easy to spot enumerators who stopped submitting or whose output dropped suddenly.
- Statistics by enumerator: Compare any numeric column across enumerators to detect systematic differences in how questions were answered
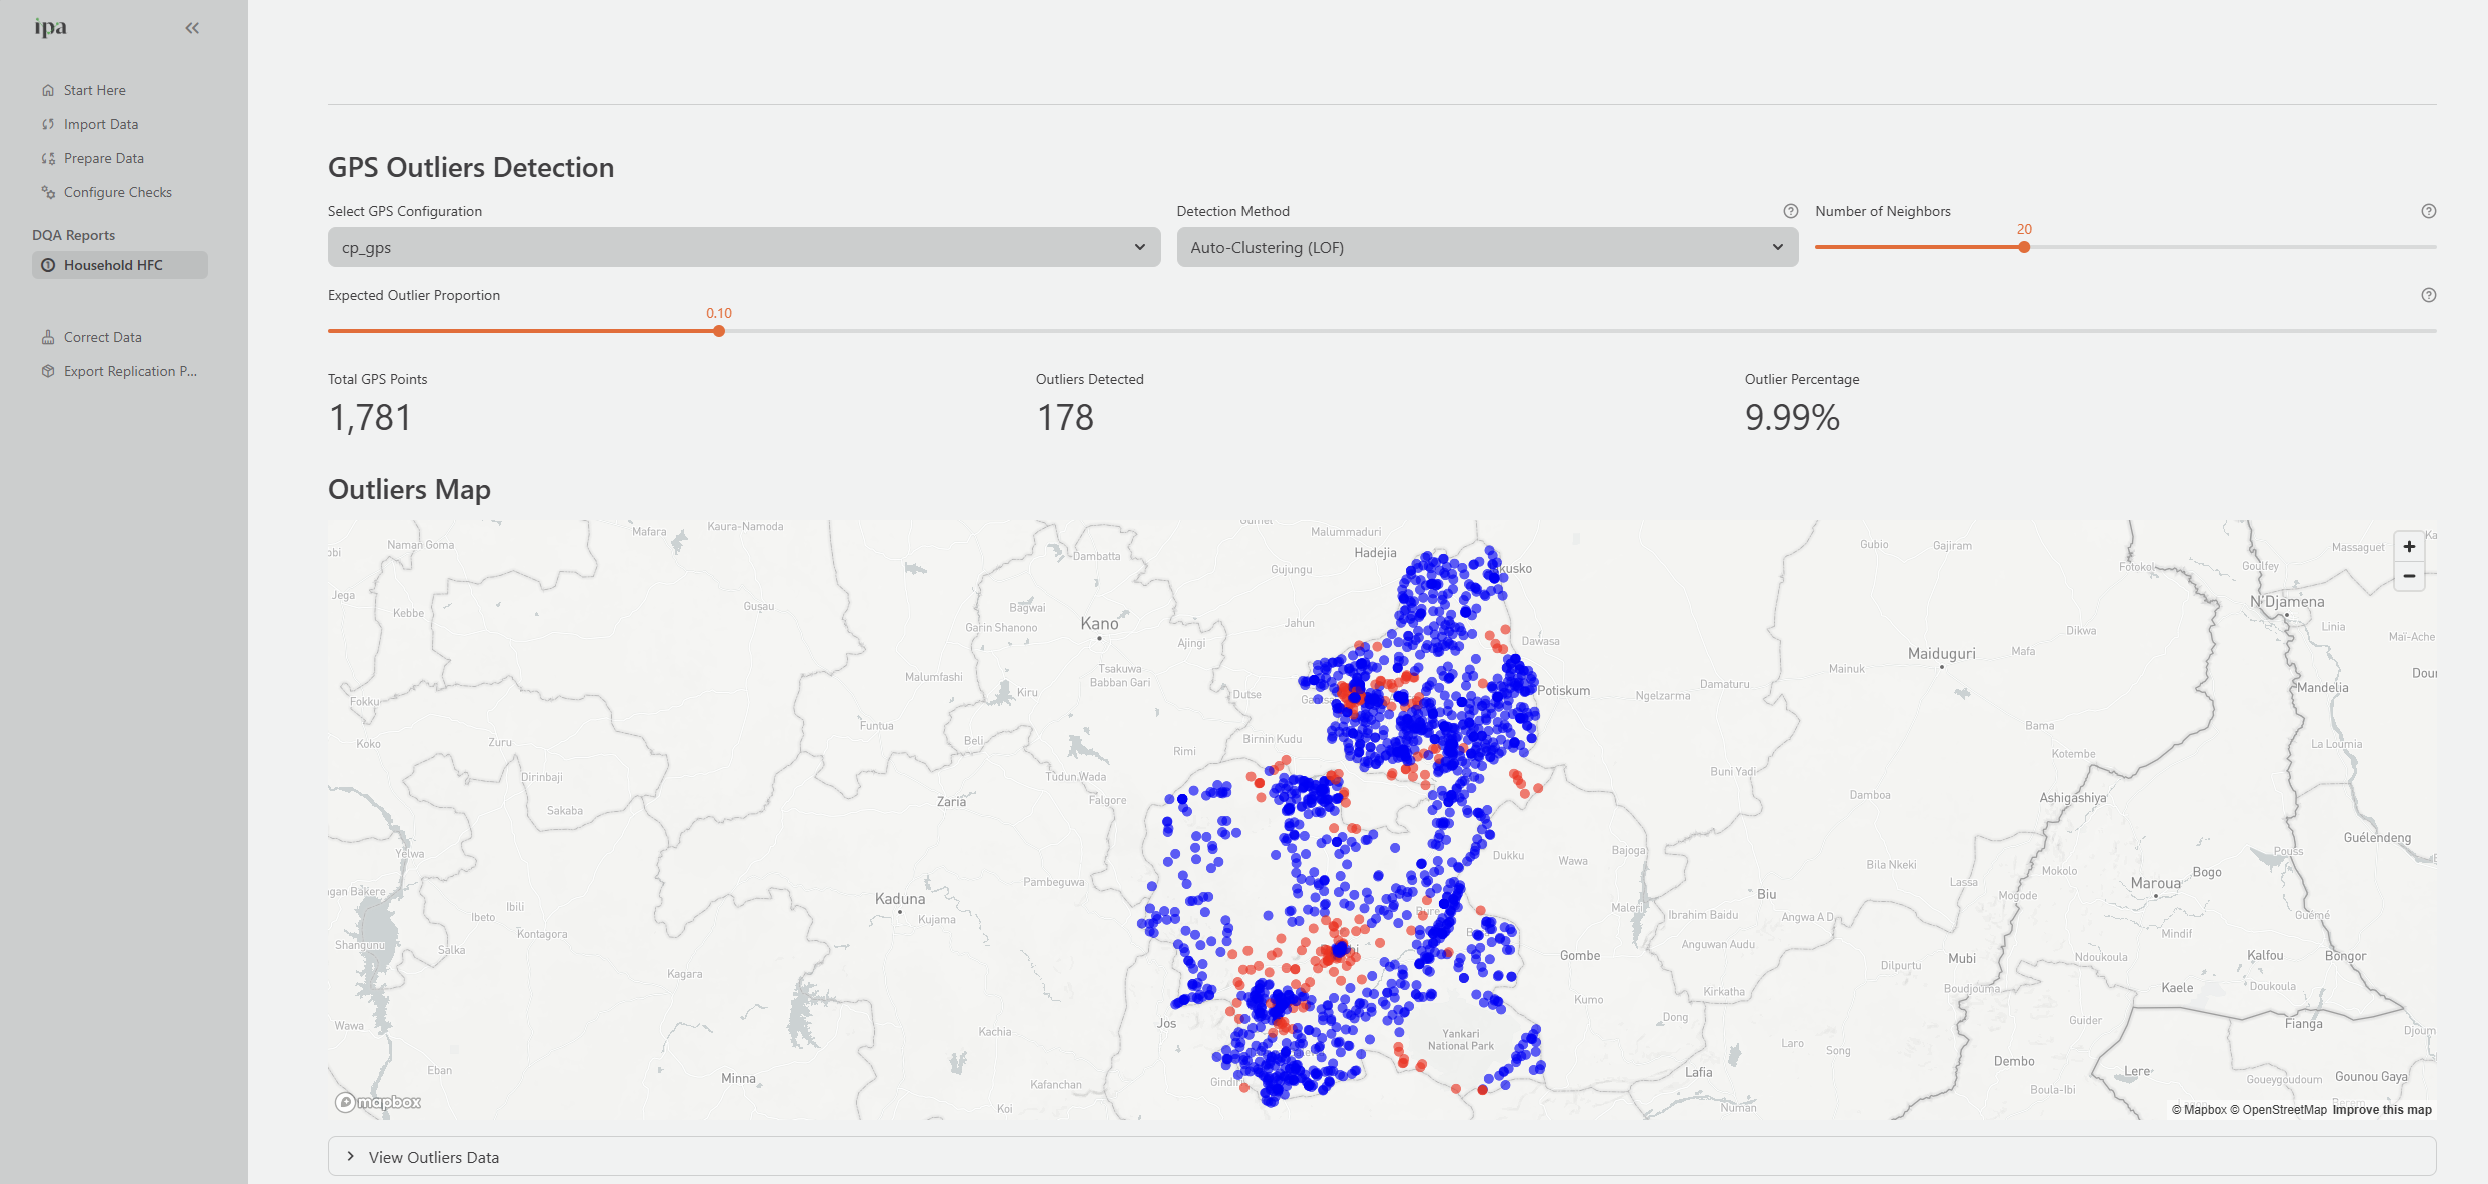
GPS Checks tab
The GPS Checks tab validates geographic coordinate data.
Configure the tab to specify whether your GPS data uses separate latitude and longitude columns or a single combined column. Optionally specify an accuracy column (SurveyCTO stores GPS accuracy in a separate column).
The results show:
- Total GPS records, valid coordinates, and invalid coordinates
- Accuracy statistics
- An interactive map with all interview locations plotted as markers
- A table of flagged records: missing coordinates, out-of-range values (latitude outside -90 to 90, longitude outside -180 to 180), and low-accuracy readings
Descriptive Stats tab
The Descriptive Stats tab shows distribution summaries for selected variables. It is useful for reviewing the composition of your data and detecting unusual distributions that might indicate collection problems, such as all respondents reporting the same income value.
Select up to 10 columns to analyze. For each column, you can choose between:
- One-Way Table: Frequency distribution for a single variable
- Two-Way Table: Cross-tabulation with another variable
- Summary Statistics: Count, mean, standard deviation, min, max, and percentiles
Back Checks tab
The Back Checks tab compares original survey responses against re-interview validation data to measure enumerator reliability.
Before reviewing results, configure the tab:
- Map the survey ID, key, enumerator, and date columns.
- Set your target backcheck rate.
- Click Add a back check column for each variable to validate. For each column, set:
- Category: A grouping number (1, 2, 3) used to organize columns in the results table
- OK Range: For numeric variables, the maximum acceptable difference between the original and re-interview response. For example, an OK range of 5 for an age variable means differences of up to 5 years are not counted as errors.
- Comparison Condition: Whether to skip comparisons when a value is missing in either dataset,
ignore_missing_values, or compare all records including those with missing values,compare_all
The results show error rates by column, by enumerator, and by back-checker, along with a record-level table showing each comparison.
[Screenshot: The Back Checks tab showing the error rate by enumerator table, sorted by highest error rate, and the record-level comparison table.]
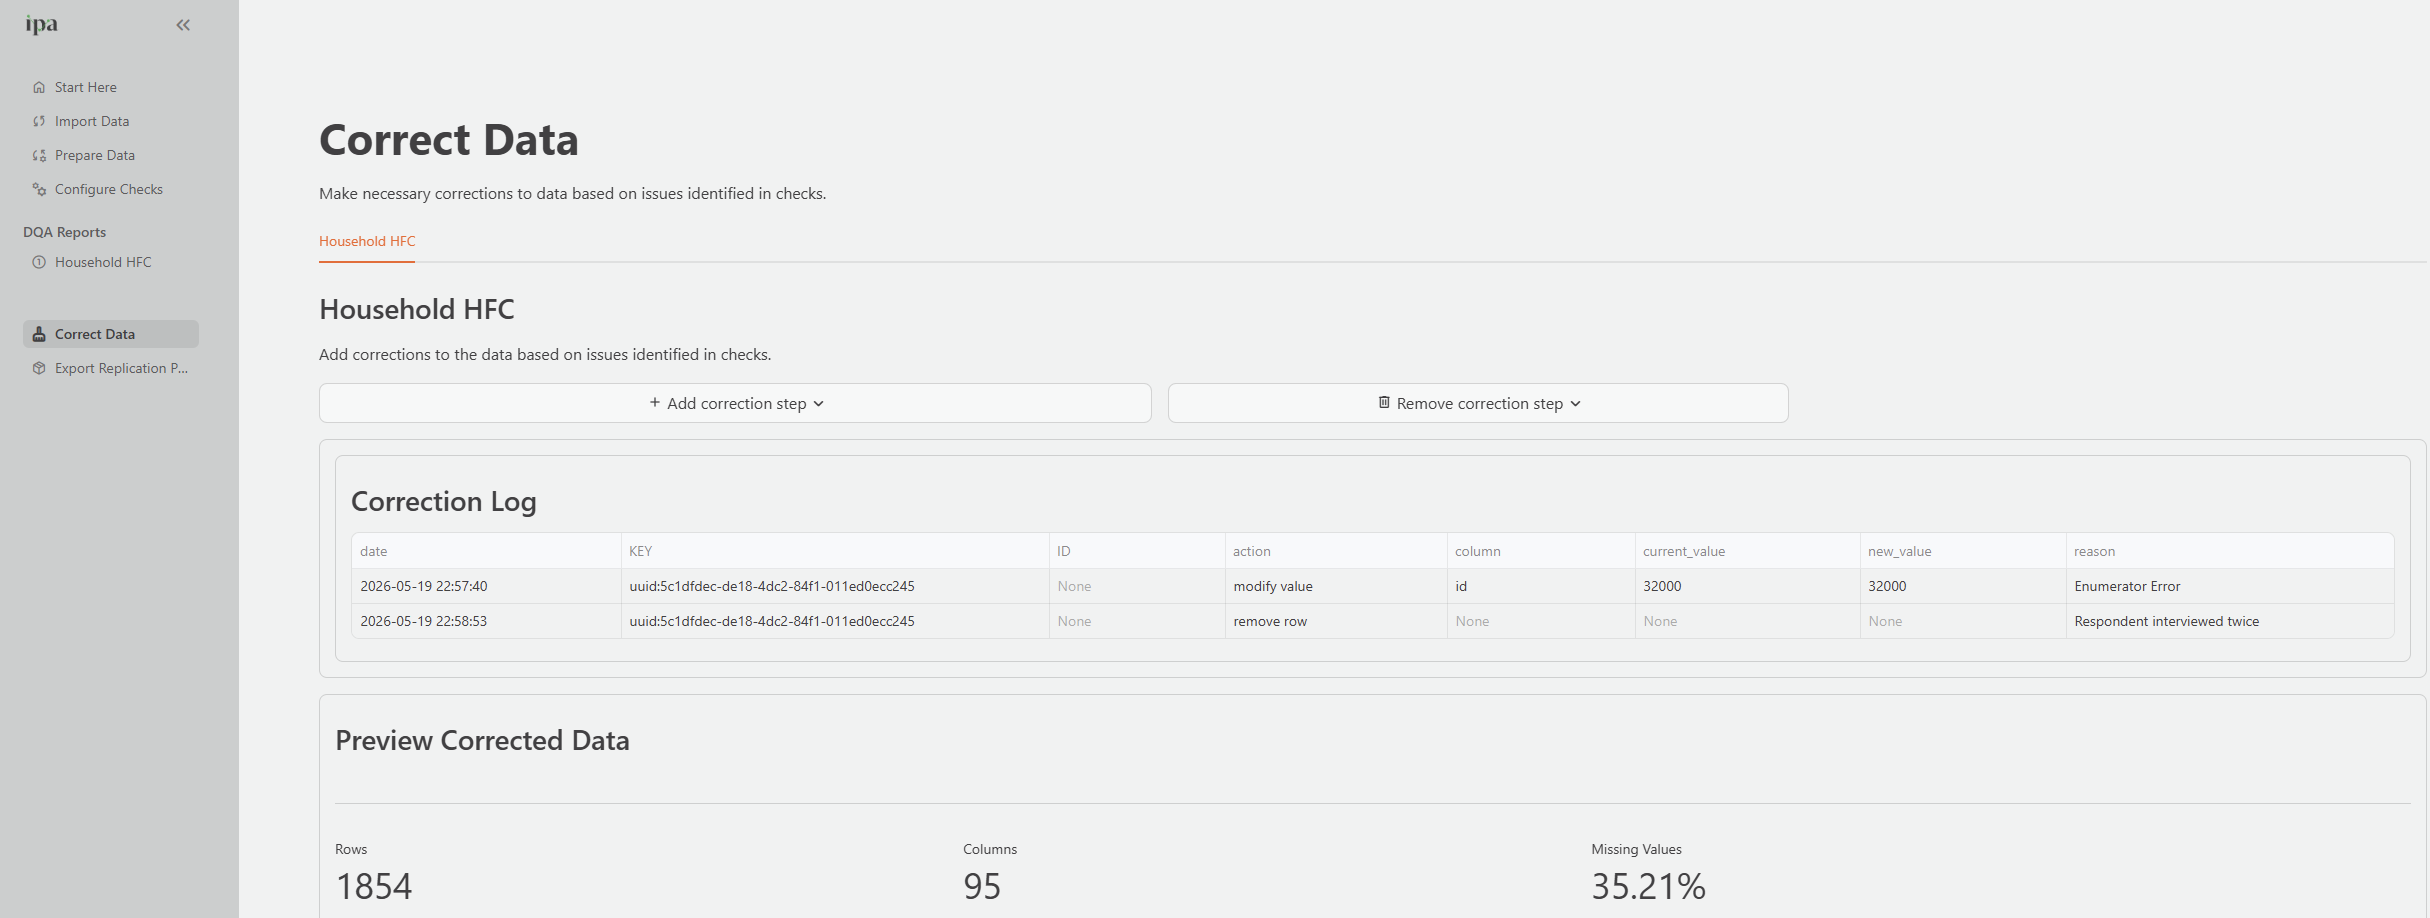
Step 6: Correct Data
The Correct Data page provides a structured workflow for fixing data quality issues found in your DQA Reports. The system logs every correction with the original value, new value, reason, action type, and timestamp. This creates a full audit trail that is also used to auto generate Stata do-files in the Replication Package.
Navigate to Correct Data from the sidebar.
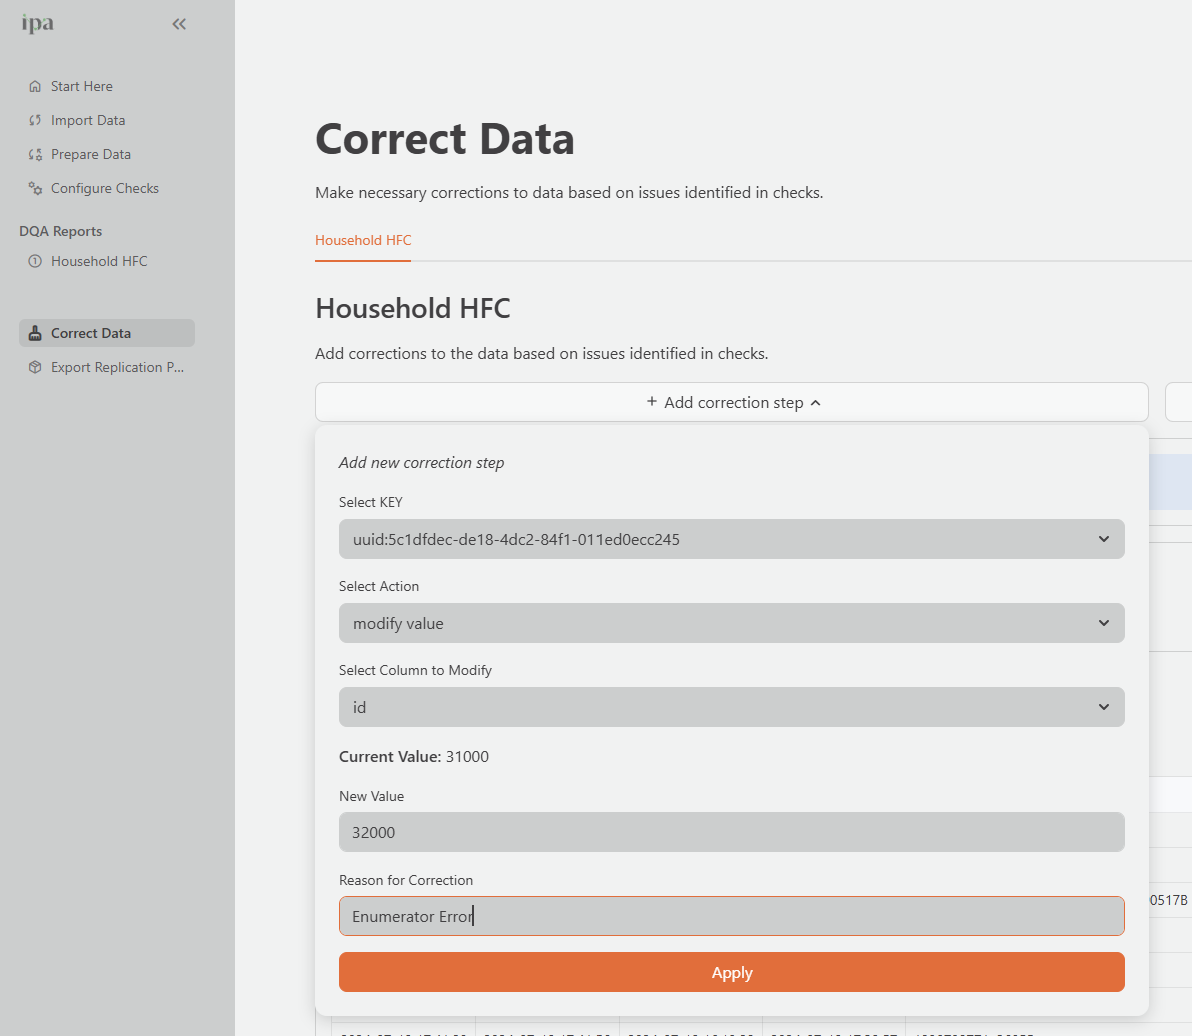
Adding a correction
- Click Add correction.
- Select the Key of the record you want to modify. This is the unique row identifier from the Key Column you specified in your check configuration.
- Select the Action:
| Action | When to Use | Example |
|---|---|---|
| Modify Value | Fix a specific value in a column | Correcting a typo in a household ID from UP015-005 to UP015-055 |
| Remove Row | Delete an entire record | Removing a test submission or a fully duplicated record after investigation |
| Remove Value | Set a specific value to missing | Removing a value which should be missing if the skip pattern worked correctly |
Select the Column to modify (not required for Remove Row).
Enter the new value, or confirm the removal.
Enter a Reason for the correction. You must complete this field, and the system adds it to the permanent audit trail. Write reasons that will be meaningful to a future reviewer who was not present during data collection.
Good examples:
"Duplicate record confirmed with supervisor -- original submission retained, duplicate removed""Household ID typo confirmed via field notes -- corrected from UP015-005 to UP015-055""Income value of 999999 is a data entry error confirmed by enumerator -- removed"
Click Apply.
Verifying a correction
After applying a correction, navigate back to the relevant DQA Report tab and confirm the flagged issue no longer appears. If it persists, check that you selected the correct key and column.
Recommended correction workflow
Corrections should always follow an investigation, not precede one. Before correcting a record, confirm the root cause.
- Identify the issue in a DQA Report tab.
- Investigate: is it a data entry error, a survey programming bug, or a legitimate extreme value?
- Consult field notes, supervisor reports, or the enumerator directly if needed.
- Apply the correction with a specific documented reason.
- Verify the resolution in the DQA Report.
- If the issue reflects a training or process problem, follow up with the enumerator to prevent recurrence.
Do not remove or modify records before investigating their root cause. A duplicate ID, for example, may be a data entry error in one record, or it may indicate that the team surveyed a respondent twice. The correct action depends on the investigation outcome.
Step 7: Export a Replication Package
The Replication Package page is the final step of the DataSure workflow. It exports a self-contained zip file that allows anyone with Stata to reproduce your corrected dataset exactly from the original raw source data. This supports IPA’s research transparency and data management standards.
Navigate to Replication Package from the sidebar.
What the replication package contains
DataSure organizes the zip file into a structured folder layout:
replication_[project]_[page]/
├── 0_README.txt
├── 1_docs/
│   ├── 1_surveys/          ← SurveyCTO questionnaire (.xlsx), if applicable
│   ├── 2_codebooks/
│   └── 3_notes/
├── 2_scripts/
│   ├── 0_main.do           ← Master script that runs all others in order
│   ├── 1_install_packages.do
│   ├── 2_import_data.do    ← Imports the raw CSV into Stata
│   ├── 3_prepare_data.do   ← Applies all prep steps from the Prepare Data log
│   └── 4_corrections.do    ← Applies all corrections from the Correct Data log
├── 3_data/
│   ├── 1_raw/              ← Raw survey data as CSV
│   ├── 2_intermediate/     ← Generated when scripts are run
│   └── 3_final/            ← Generated when scripts are run
└── 4_output/
    ├── 1_tables/
    ├── 2_figures/
    └── 3_logs/
        ├── correction_log.csv
        └── prep_log.csv
The Stata do-files 2_import_data.do, 3_prepare_data.do, and 4_corrections.do are auto generated by DataSure from the preparation steps and corrections you logged during your project. You do not need to write any Stata code yourself. Running 0_main.do in Stata will reproduce the full corrected dataset from scratch.
If you imported your data from SurveyCTO, DataSure will also attempt to download the survey questionnaire XLS file from the server and include it in the 1_docs/1_surveys/ folder.
Building the package
- On the Replication Package page, select the Page Name corresponding to the check configuration you want to export.
- Review the configuration details that appear below the selector to confirm that DataSure shows the correct dataset and key column.
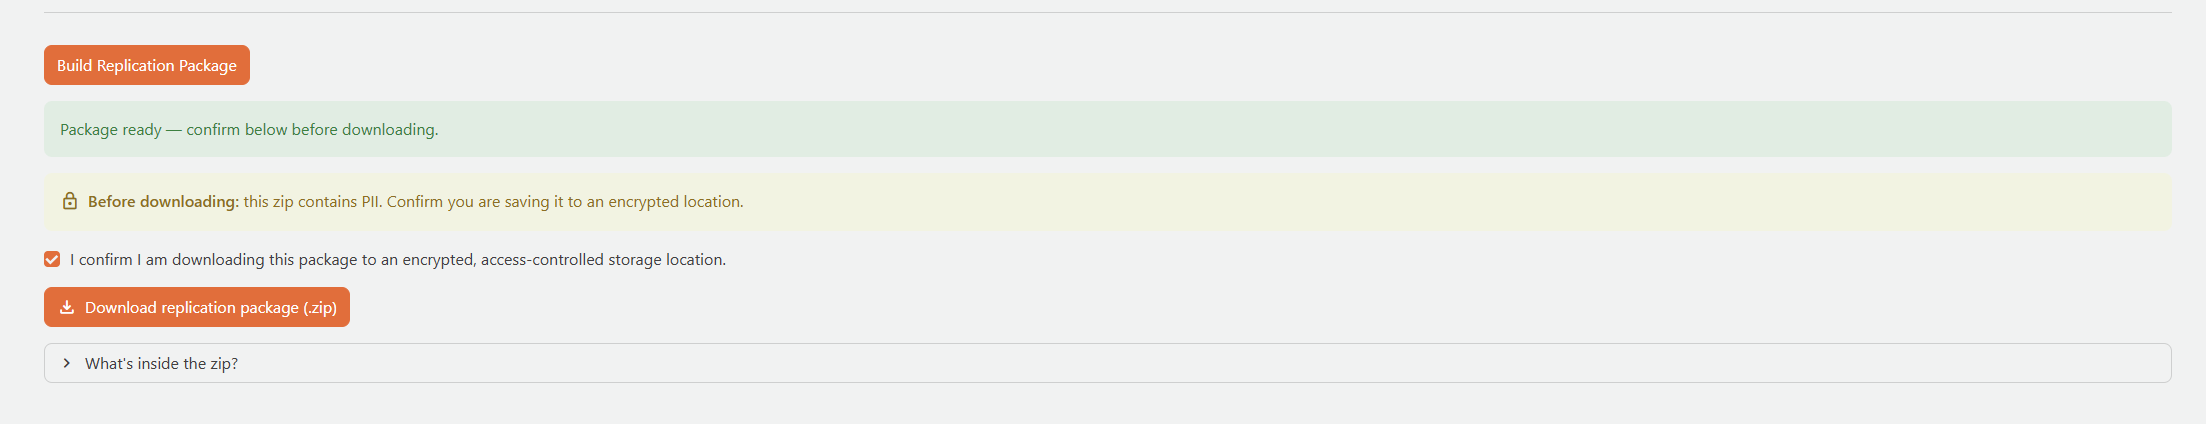
- Expand What is inside the zip? to preview the full directory structure before building.
- Click Build Replication Package. DataSure assembles the package in the background and shows progress as it builds each component.
Downloading the package
The replication package includes raw survey data, which may contain personally identifiable information (PII) such as respondent names, locations, or contact details. You must download it only to an encrypted, access-controlled storage location in compliance with IPA data security and confidentiality policies. Do not store the package on unencrypted drives, shared folders, or cloud services not approved for confidential data.
See IPA’s Data Security Protocol for guidance on approved storage.
After the build is complete:
- Read the PII warning.
- Check the confirmation box to confirm you are saving to an encrypted location.
- Click Download replication package (.zip).
Who should use the replication package
Use the replication package for:
- Archiving at project closure: Submit the package alongside your final dataset so that future researchers or auditors can reproduce your data processing pipeline.
- Peer review and verification: Share with a colleague or IPA’s GRDS team to verify that the team applied corrections and prep steps correctly.
- Handover: If a project changes hands, the package provides a complete record of every decision made during data cleaning.
Keeping DataSure Up to Date
To upgrade DataSure to the latest version, run:
uv tool upgrade datasureCheck the DataSure release notes for a summary of what changed in each version before upgrading.
Getting Help
- GitHub Issues: Report bugs or request features at the DataSure repository
- Email support: Contact IPA’s Global Research and Data Science team at researchsupport@poverty-action.org
If your project needs help setting up or running DataSure, IPA’s Global Research and Data Science team provides direct technical support. Email researchsupport@poverty-action.org.